Large Bank Stocks Driven by the Spread Between ROE and COE
The major bull market in bank stocks (KBW Index, Ticker “BKX”) from the 1st quarter of 1995 to year end 2006 of 300% was driven by the widening spread between bank return on equity (ROE*) and the cost of equity (COE**), as defined by IDC Financial Publishing, Inc. (IDC). During the 12-year period, ROE averaged 14.5%, rising to a peak of 16.4% as of March, 2000 and declining to 13.5% in 2006. The major driver, however, in the bank stock bull market was the decline in the cost of equity capital (COE) for banks. COE equaled ROE in 1994, the low in the KBW index of large bank stocks (BKX) of slightly below 30 in 1994. As the COE declined from 14.3% at year-end 1994 to 10% in the 1999 to 2002 period, bank stock prices (BKX) rose three-fold from 30 to 90. Another decline in COE from 10% in 2002 to 8.1% in 2006 sparked a bull market in the BKX from 75 in 2002 to 115 in 2006.
The great bear market in bank stocks from 2006 to March 2009 from 117 to 28 resulted from a collapse in ROE from 13.5% at year-end 2006 to 5.1% in March 2010. The COE reached a low of 6.9% in March 2009 and rose to 10% by March 2011. The bottoming process in bank stock prices from March 2009 to year-end 2011 experienced a ROE below COE, causing extremely low valuations below book value.
A new bull market began at year-end 2011, as ROE again rose above COE. ROE increased from 7.9% at year-end 2011 to an average of 9% for 2013 to date. COE peaked at 10% in March 2011 and declined to 4.1%, as of June 2015. The BKX nearly doubled from 40 in March 2012 to 78 in 2015.
Future COE, which is based on 30-year U.S. Treasury Bond yields and bank risk, at best, remains near 4%. If interest rates rise on long-term bonds in a stronger economy, COE will increase. Bank stocks would then require ROE expansion greater than the rise in COE to drive higher bank stock valuations.
The major opportunity for bank stock prices to recover or begin a new bull market is for ROE to rise above the current level of 9.3% to 11% or higher, while COE remains below 5%.
The recent rise in the BKX Index reflects optimism in the market for the banking industry (see chart below). Current earnings releases show a recovery for large bank holding companies. JP Morgan Chase reported ROE for the 1st quarter of 2017 at 11%, the 7th straight quarter above 10%. Citigroup Inc. reported a ROE of 7.4%. Although the highest in 7 quarters, it appears still low compared to other large institutions. Wells Fargo & Co reported an 11.5% ROE.
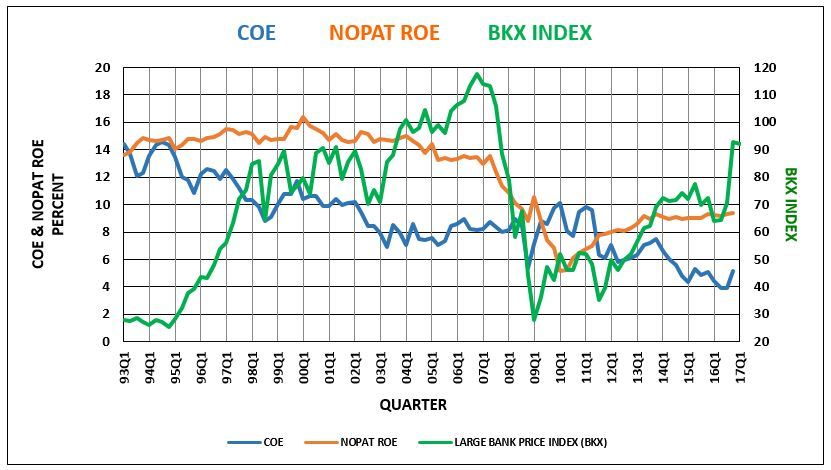
ROE and COE used in the chart above are the asset weighted average of all U.S. banks for each quarter.
* ROE as defined by IDC is net operating profit after tax (NOPAT ROE). In order to balance bank balance sheets and correct for over or under statement of the reserve for loan losses, the increase in the loan loss reserve adjusts net income reflecting net charge-offs vs. the loan loss provision. ROE can also then be defined as the Return on Earning Assets after-tax (before funding costs) plus the Return on Financial Leverage (after-tax cost of funding times leverage).
** COE as calculated by IDC uses a combination of general risk and specific risks. General risk is demonstrated by the 30-year T-Bond yield, while the risk premium for financial equities adjusts another 50% of the 30-year bond yield for specific risks. Specific risks for an individual financial institution include asset size, pretax coverage of net loan charge-offs, loan delinquency risk to capital, and variations in operating profit margins.