Savings Institution Quarterly
Savings Institution Quarterly is One of the Nation's Prime Sources of Quality Ratings Since 1985
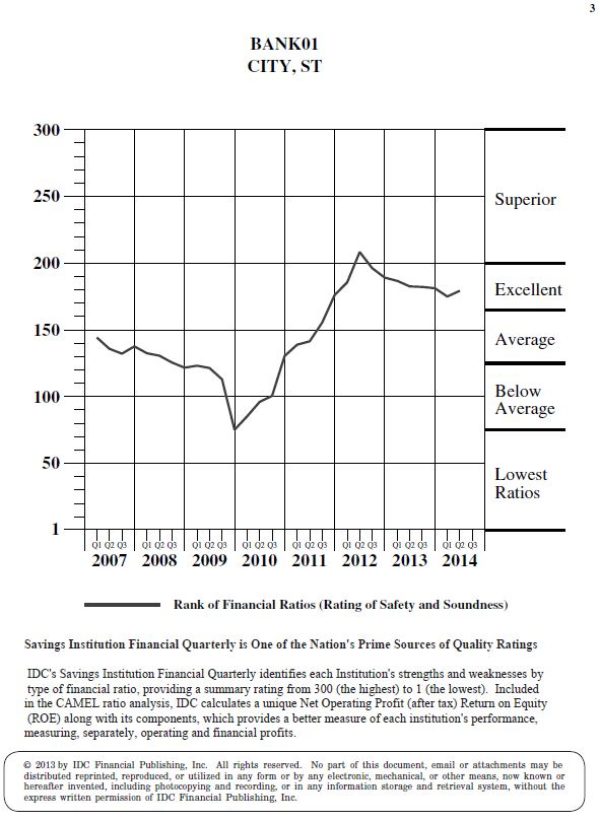
IDC's Savings Institution Quarterly identifies each institution's strengths and weaknesses by type of financial ratio, providing a summary rating from 300 (the highest) to 1 (the lowest). The summary rank is categorized 300-200 "Superior", 199 to 165 "Excellent", 164 to 125 "Average", 124 to 75 "Below Average", and 75 to 1 "Lowest Ratios". Included in the CAMEL ratio analysis, IDC calculates a unique Net Operating Profit (After Tax) Return on Equity (ROE) along with its components, which provides a better measure of each institution's performance, measuring, separately, operating and financial profits.
Sample Institution Case Study
The Sample Institution case is a study of a superior ranked institution that developed some problems as it dropped its rank from a "190" (excellent) in the third quarter of 2005 to a rank of "75" (below average) in the fourth quarter of 2009. Management at the Sample Institution recognized the problems they were having, reacted quickly to take mitigating action and the institutions rank has since recovered to its current "179" (excellent) in the second quarter of 2014.
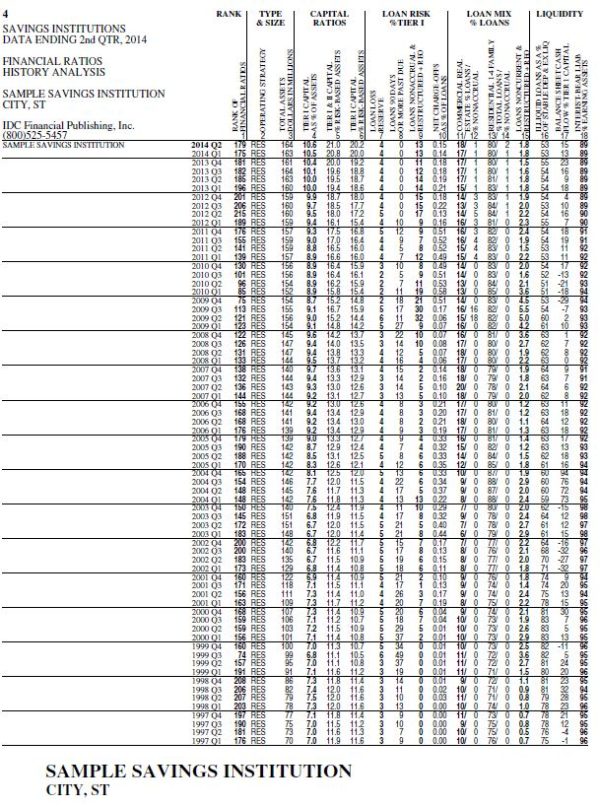
Capital risk is determined by Tier I capital as a percent of assets and as a percent of risk based assets. Tier I & II capital as a percent of risk-based assets (total risk-based capital ratio) measures credit and interest rate risk, as well as estimates risk in the asset base. The Sample Institution's Tier 1 capital as a % of assets (column 4) reached 9.0% in the year 2005, declined slightly to 8.7% in the fourth quarter of 2009 and recovered to 10.6% by the second quarter of 2014. The Sample Institutions total risk-based capital (column 5) rose to 21.0% of risk-based assets and at the same time its Tier 1 risk-based capital (column 6) rose to 20.2% of risk-based assets.
Adequacy of Capital and reserves measures the levels of delinquent loans, nonaccrual loans, restructured and foreclosed assets relative to loan loss reserves and capital. Risk-adjusted assets as part of the risk-based capital ratio further define the quality of assets. The Sample Institution's loans on non-accrual, restructured loans, and OREO as a percent of Tier 1 capital (column 9) along with loans 90 days or more past due as a percent of Tier 1 capital (column 8), added together, were 11% of Tier 1 capital in the third quarter of 2005, rose to 47% of Tier 1 capital in the third quarter of 2009, and subsequently decreased to 13% of Tier 1 capital in the second quarter of 2014. The decrease is indicative of management's efforts to control non-performing assets.
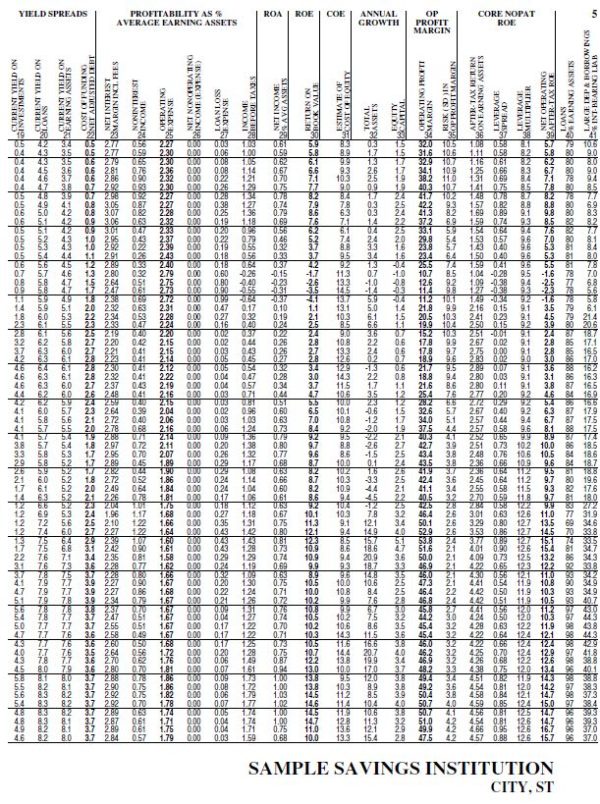
Margins are the best measurement of management's financial controls. Margins represent the spreads between 1) operating profit and net operating revenues, 2) after-tax return on earning assets and cost of funding, and 3) the return on equity compared to estimated cost of equity capital. The Sample Institution's net interest margin (column 23) in the fourth quarter of 2005 was 2.88%, dropped to 2.19% by the fourth quarter of 2008 and recovered to 2.77% by the second quarter of 2014. The operating profit margin (column 34) reflected a similar change dropping from 40.3% to 10.7% and recovering to 32.0%.
Earning returns measure the success of the institution's operating strategy. Ratios of revenue yields from investments, loans, and noninterest income with comparison to operating costs, less loan loss provision, plus net loan charge-offs, and net non-operating income ratios are the major components of the net operating after-tax return on earning assets (ROEA). Earnings from financial leverage measure the level of leverage and after-tax cost of funding compared to the ROEA. Operating assets are financed with the leverage of deposits and borrowings to Tier I capital and its comparative cost. The leverage multiplier illustrates the degree of leverage, while the leverage spread measures its cost relative to operating returns. The Sample Institution's net operating after-tax return on equity (column 39) decreased from 8.9% in the fourth quarter of 2005 to -2.5% in the second quarter of 2010 and recovered to 5.7% in the second quarter of 2014. Although ROEA (column 36) decreased from 2.52% in the fourth quarter of 2005 to 1.08% in the second quarter of 2014, the driver of the net operating after-tax return on equity was the leverage spread (column 37), which changed dramatically through the study period, decreasing from .65% in the fourth quarter of 2005 to -0.38% in 2010, subsequently, rising to its current 0.58% in the second quarter of 2014.
Liquidity measures (1) balance sheet cash flow as a percent of Tier I capital (column 17) and (2) loans compared to stable deposits and borrowings plus estimated unused lines of credit at the Federal Home Loan Institution (column 16). The Sample Institution's balance sheet cash flow percentage dropped to a negative position in the third quarter of 2009 and remained negative for 5 consecutive quarters before recovering. Loans as a percent of stable deposits and borrowings decreased slightly through the study period but remained fairly stable.
Congratulations to a Sample Institution that is well capitalized, controls nonperforming assets, provides sufficient margins to earn an ROE greater than COE, and maintains a high level of balance sheet liquidity to support future growth.