Community Bank Stocks Driven by Spread Between ROE and COE
In a previous article, the major bull market in bank stocks from the first quarter of 1995 to year-end 2006 of 300% was driven by the widening spread between return on equity (ROE*) and the cost of equity (COE*), as defined by IDC Financial Publishing, Inc. (IDC). In the article, IDC demonstrated the major driver in the bank stock performance in the bull market was the decline in the cost of equity (COE), as the ROE fluctuated around 14.5%, reaching a peak of 16.4% in March, 2000 and declining to 13.5% at the end of 2006 (See article below).
The bear market, with a sharp decline in ROE for banks, began from the end of 2006 to March, 2009. The large bank stock index (BKX) declined 76.3% from 117.78 on December 31, 2006 to 27.90 on March 31, 2009.
How Did Community Banks Perform Relative to Large Bank Stocks (ABAQ vs BKX)?
The community bank stock index (ABAQ) began in 2004, reaching a peak of 311.29 on December 31, 2006 and declining to 138.33 on March 31, 2009 for a 55.6% decline, less than the 76.3% drop in the large bank stock index (BKX). -- See Chart I
Bank stocks both large and community fell into a losing pattern from June of 2009 to the end of 2011, as the COE rose and remained above ROE (See Chart II).
The next bull market for all bank stocks began in late 2011 as the ROE again rose above COE. ROE increased from 7.9% at year-end 2011 to an average of 9% for 2013 to-date for all banks. More importantly, COE peaked at 10% in March 2011 and declined to 4.1% as of June 2015, falling below ROE in the 4th quarter of 2011.
From a low in September, 2011 to June, 2015, the large banks BKX rose 120.5%, while the community banks increased 108% (ABAQ for all community banks rose 108.2% and ABQI for actively traded community bank stocks increased 108.7% -- See Charts II and III).
Forecasting ROE for bank stocks requires an economic variable that predicts profitability. Since bank stock profits, in large part, depend on real estate lending, the Housing Market Indicator (HMI) is a leading indicator forecasting changes in ROE. The HMI is a survey of realtors’ expectations of home sales, traffic and other housing indicators. The HMI peaked in mid-2005, leading the peak and decline in bank ROE in June 2007. The low in HMI in March, 2009 predicted the low in ROE as of December, 2009. Currently, HMI reached new cycle highs, predicting firm, if not, rising ROEs for bank stocks (See charts II and III).
The potential future problem for bank stocks is a rise in COE faster than the increase in ROE in a stronger economy. COE, which is primarily a function of 30-year U.S. Treasury yields, fell to a low of 3.9% in a world of monetary stimulus and negative interest rates in 2016. More recently, long government yields have begun to increase. A 3% long U.S. Treasury yield, up from 2.3% in September 2016, would drive a 5% cost of equity (COE) for bank stocks, while a 3.5% yield on 30-year T-Bonds equates to a 5.9% COE.
The opportunity for bank stocks to appreciate in the future is for ROE to rise above current levels of 9.3% to 11% or higher, while COE remains near 5%. A spread between ROE and COE of 6% or more is necessary to foster a new bull market in bank stocks.
(See Article Below on Large Bank Stocks)
Chart I
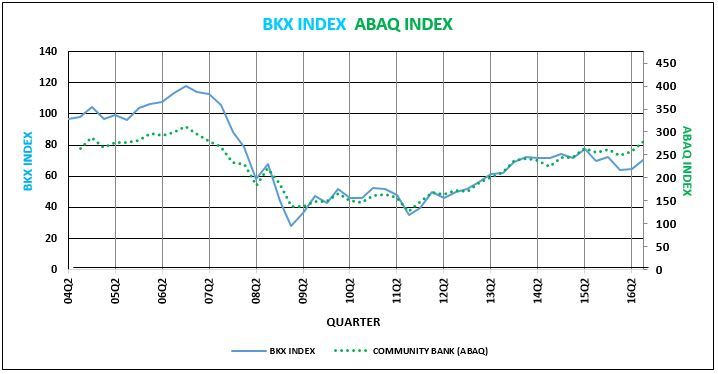
Chart II
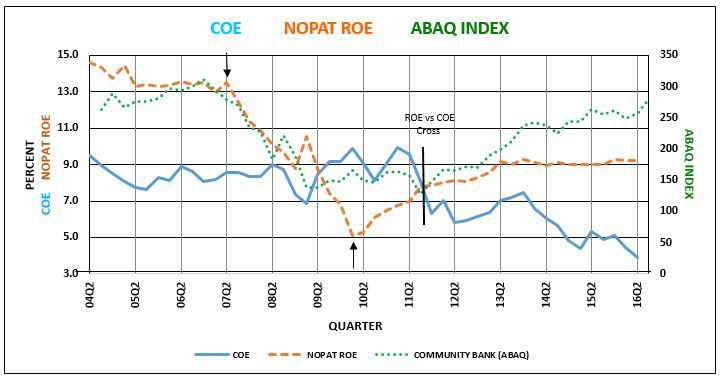
ROE and COE used in chart II above are the asset weighted average of all U.S. banks for each quarter.
Chart III
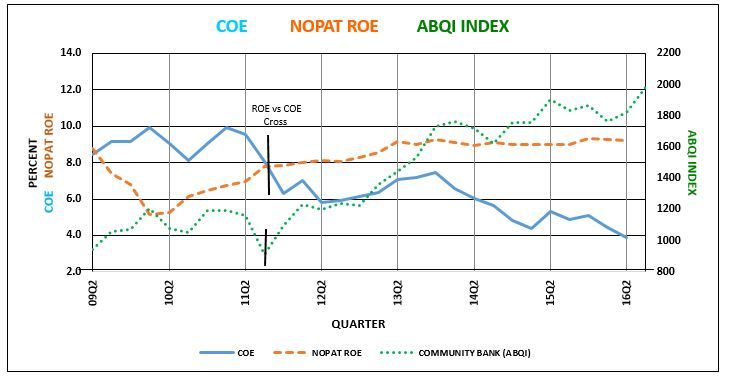
ROE and COE used in chart III above are the asset weighted average of all U.S. banks for each quarter.
Chart IV
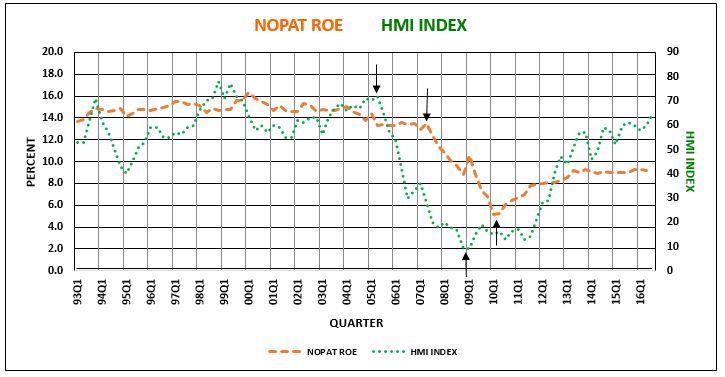
ROE used in chart IV above is the asset weighted average of all U.S. banks for each quarter.
* ROE as defined by IDC is net operating profit after tax (NOPAT ROE). In order to balance bank balance sheets and correct for over or under statement of the reserve for loan losses, the increase in the loan loss reserve adjusts net income reflecting net charge-offs vs. the loan loss provision. ROE can also then be defined as the Return on Earning Assets after-tax (before funding costs) plus the Return on Financial Leverage (after-tax cost of funding times leverage).
** COE as calculated by IDC uses a combination of general risk and specific risks. General risk is demonstrated by the 30-year T-Bond yield, while the risk premium for financial equities adjusts another 50% of the 30-year bond yield for specific risks. Specific risks for an individual financial institution include asset size, pretax coverage of net loan charge-offs, loan delinquency risk to capital, and variations in operating profit margins.
Large Bank Stocks Driven by the Spread Between ROE and COE
(Originally published on September 30, 2016)
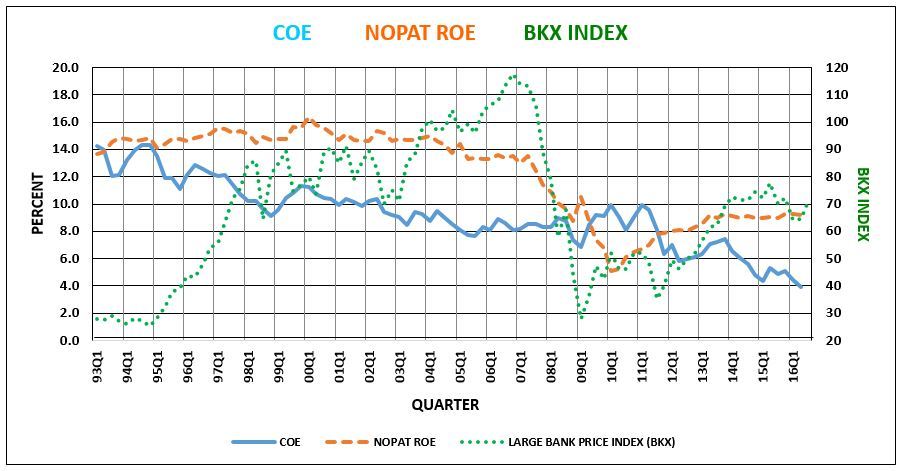
The major bull market in bank stocks (KBW Index, Ticker “BKX”) from the 1st quarter of 1995 to year end 2006 of 300% was driven by the widening spread between bank return on equity (ROE*) and the cost of equity (COE**), as defined by IDC Financial Publishing, Inc. (IDC). During the 12 year period, ROE averaged 14.5%, rising to a peak of 16.4% as of March, 2000 and declining to 13.5% in 2006. The major driver, however, in the bank stock bull market was the decline in the cost of equity capital (COE) for banks. COE equaled ROE in 1994, the low in the KBW index of large bank stocks (BKX) of slightly below 30 in 1994. As the COE declined from 14.3% at year-end 1994 to 10% in the 1999 to 2002 period, bank stock prices (BKX) rose three-fold from 30 to 90. Another decline in COE from 10% in 2002 to 8.1% in 2006 sparked a bull market in the BKX from 75 in 2002 to 115 in 2006.
The great bear market in bank stocks from 2006 to March 2009 from 117 to 28 resulted from a collapse in ROE from 13.5% at year-end 2006 to 5.1% in March 2010. The COE reached a low of 6.9% in March 2009 and rose to 10% by March 2011. The bottoming process in bank stock prices from March 2009 to year-end 2011 experienced a ROE below COE, causing extremely low valuations below book value.
A new bull market began at year-end 2011, as ROE again rose above COE. ROE increased from 7.9% at year-end 2011 to an average of 9% for 2013 to date. COE peaked at 10% in March 2011 and declined to 4.1%, as of June 2015. The BKX nearly doubled from 40 in March 2012 to 78 in 2015.
Future COE, which is based on 30-year U.S. Treasury Bond yields and bank risk, at best, remains near 4% unless the U.S. moves to negative bond yields. If interest rates rise on long-term bonds in a stronger economy, COE will increase. Bank stocks would then require ROE expansion greater than the rise in COE to drive higher bank stock valuations.
The major opportunity for bank stock prices to recover or begin a new bull market is for ROE to rise above the current level of 9.3% to 11% or higher, while COE remains below 5%.
ROE and COE used in the chart above are the asset weighted average of all U.S. banks for each quarter.
* ROE as defined by IDC is net operating profit after tax (NOPAT ROE). In order to balance bank balance sheets and correct for over or under statement of the reserve for loan losses, the increase in the loan loss reserve adjusts net income reflecting net charge-offs vs. the loan loss provision. ROE can also then be defined as the Return on Earning Assets after-tax (before funding costs) plus the Return on Financial Leverage (after-tax cost of funding times leverage).
** COE as calculated by IDC uses a combination of general risk and specific risks. General risk is demonstrated by the 30-year T-Bond yield, while the risk premium for financial equities adjusts another 50% of the 30-year bond yield for specific risks. Specific risks for an individual financial institution include asset size, pretax coverage of net loan charge-offs, loan delinquency risk to capital, and variations in operating profit margins.