Credit Unions – A New Growth Opportunity in Brokered CDs
Credit unions issuing brokered CDs averaged just 5 institutions per quarter from 2008 to 2015. Beginning in the 2nd quarter of 2015, these institutions accelerated from 5 to 92 by the 2nd quarter of 2018, and, as of this article publishing date, rose again to 119. IDC Financial Publishing (IDCFP) estimates by 2020, credit unions with brokered CDs outstanding could reach 300 or more. This new growth opportunity in brokered CDs makes monitoring credit unions increasingly important.
IDCFP uses the acronym CAMEL to represent the financial ratios used to evaluate the safety and soundness of commercial banks, savings institutions and credit unions. In the following article IDCFP measures these components of its CAMEL ranks specific to credit unions.
IDCFP’s CAMEL ratings of banks, savings institutions, and credit unions range from 300 (the top grade attainable) to 1 (the lowest). From the early 1990’s, through today, institutions using our ranks determined that ratings lower than 125 were deemed below investment grade.
A Forecast for the Next Problem Period in Credit Unions
Out of the 5,589 total credit unions, IDCFP has identified 92 that have outstanding brokered deposits as of June 30th, 2018. Using this group of 92, and tracking those ranked less than 125 within this group, provides a preliminary forecast for the next era of potential problems in 2021. The sample of 92 institutions is small but accelerating, with $4.1 billion in estimated brokered CDs, and is a key segment to monitor.
Table I illustrates this trend in credit unions ranked less than 125, which reached a low of 2 in the third quarter of 2017 and rose to 8 in the second quarter of 2018. In addition, some CAMEL components are exhibiting signs of possible problems to come.
- The “C” component, or credit unions with insufficient capital, remains at 0 in the second quarter of 2018.
- The “A” component, which represents credit unions lacking adequacy of capital to cover delinquency with less than 5% risk-adjusted capital, remains at 0 in the second quarter of 2018.
- The “M” component, which uses margins as a measure of management, reached a low of 0 in the third quarter of 2017 and rose to 3 in the second quarter of 2018.
- The “E” component, which represents credit unions exhibiting negative earnings or returns on financial leverage (ROFL), fell to a low of 1 in the third quarter of 2017 and rose to 6 in the second quarter of 2018.
- Finally, the “L” component, representing negative liquidity, or high levels of loan delinquency with negative balance sheet cash flow, remains at 0 in the second quarter of 2018.
When examining credit unions with outstanding brokered deposits, there is an increase in the number among these ranked less than 125 by IDCFP (see Table I). The current trend shows the numbers in two components of CAMEL (“M” and “E”) have hit lows and are rising. This group of credit unions ranked less than 125, and having brokered deposits, points to another potential problem period in 2021. Similarly, from 2005 to 2007, IDCFP’s CAMEL ranks under 125 of all credit unions forecast that crisis from 2008 to 2011 (See Table II).
Table I
Early Warning Indicators in History
The 894 credit unions ranked below 125 plus two elements of CAMEL reached lows in the 3rd quarter of 2006, and steadily rose during the two years before the financial crisis in 2008. More importantly, leading up to this point, 1 out of the 5 components of CAMEL reached a low in the 1st quarter of 2005, and began to rise.
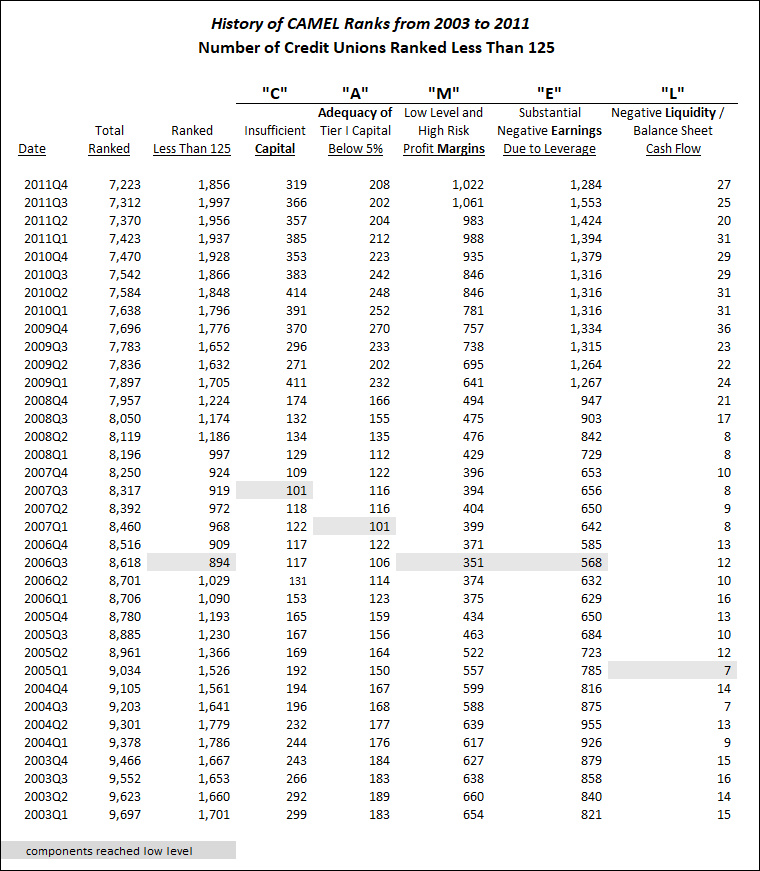
As seen in Table II below,
- Credit unions with insufficient capital reached a low of 101 in the 3rd quarter of 2007.
- Those with less than 5% risk-adjusted capital to cover loan delinquency, or lacking adequacy of capital, reached a low count of 101 in the 1st quarter of 2007.
- Credit unions with a lack of profitability, or low and unstable margins, reached a low count of 351 in the 3rd quarter of 2006.
- The credit unions with severe negative earnings due to financial leverage reached their low of 568 in the 3rd quarter of 2006.
- Finally, those with high loan delinquency and negative balance sheet cash flow, or negative liquidity, reached a low of 7 in the 1st quarter of 2005.
The credit union crisis, which was forecast by IDCFP’s CAMEL ranks in the third quarter of 2006, continued to accelerate resulting in more credit unions ranked less than 125, reaching its peak of 1,997 institutions in the third quarter of 2011 (see Table II).
Table II
All 5 categories of rank, Capital, Adequacy of capital, Margins as a measurement of management, Earnings from operations and financial leverage, and, finally, Liquidity,
together provide a timely indication of risk and potential failure. An
increase in the number of credit unions ranked under 125 in all
components of CAMEL is required to confidently forecast a future crisis.
As seen in history, the increase in the number of credit unions with IDCFP’s CAMEL ranks below 125, or below investment grade, forecast the credit union financial crisis from 2008 to 2011. IDCFP’s ranks are critical for investors to monitor credit unions and other financial institutions.
To view our products and services please visit our website at www.idcfp.com . For more information about our CAMEL ranks, or for a copy of this article, please contact us at 800-525-5457 or info@idcfp.com.
John E Rickmeier, CFA, President, jer@idcfp.com
Robin Rickmeier, Marketing Director