HAPPY NEW YEAR from IDC Financial Publishing!
ROE Compared to COE is the Best Indicator of Bank Stock Value
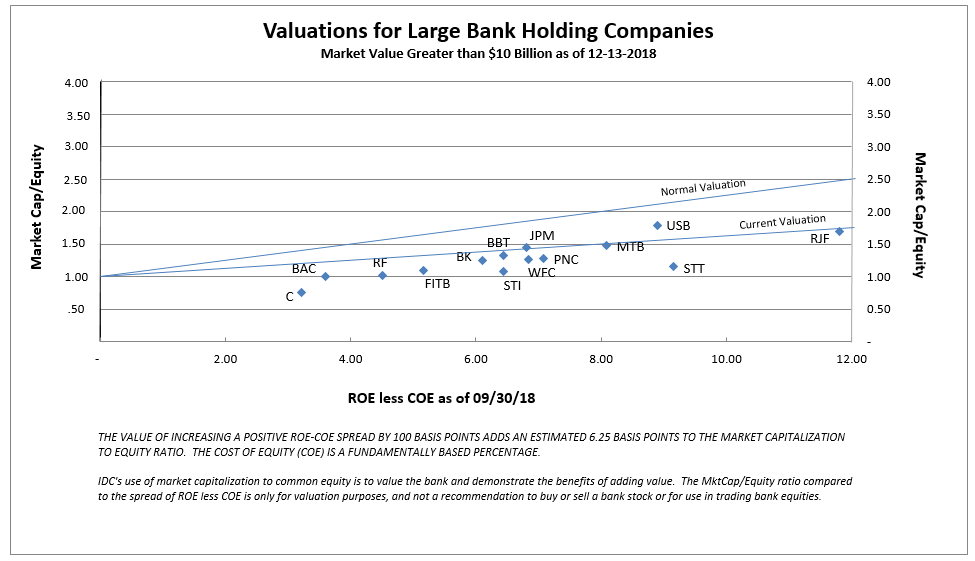
IDC Financial Publishing (IDCFP) measures relative profitability of bank holding companies by comparing the IDCFP return on equity (NOPAT ROE) to its definition of the cost of equity (COE). Margin between ROE and COE (included in the “M” in IDCFP’s unique CAMEL analysis) is a key measure of management. If the spread of ROE less COE is positive, management is creating value; the wider the spread, the greater the value. If the spread of ROE less COE is negative, management is destroying value. Bank value, in turn, is then determined by comparing its stock price to its book value, i.e. equity market capitalization to book value of common stock, versus the spread between ROE and COE (see Chart I).
Some critics say the method is flawed because of the various ways ROE and COE can be calculated. As an example, banks have insisted returns should be measured on tangible equity, excluding goodwill, and other intangible assets. This exclusion generates a higher tangible ROE, but lower tangible book value. It also distorts the spread between ROE and IDFP’s COE. IDCFP uses a nominal NOPAT ROE, as calculated for the bank holding company, and has found this to be most accurate.
The second piece of the equation is cost of equity (COE). Some analysts use a standard of 10% COE. The COE, as defined by IDCFP, however, is the 30-year T-Bond yield plus one-half of this yield, plus individual bank risk, calculated as 20% of the standard deviation of the bank’s operating profit margin. In today’s market, a long bond U.S. Treasury yield on 09/30/2018 was 3.0% and the average COE for all large bank holding companies was 5.1%, with valuations ranging from 4.48% for PNC Financial Group (PNC) to 6.14% for Bank of America Corp (BAC). See Chart I below.
There is a high correlation between Market Capitalization/Book Common Equity compared to IDCFP’s spread of ROE less COE for large bank holding companies, as shown in the enclosed Chart I. This correlation demonstrates how COE, when defined by long-term U.S. Treasury yields, best determines cost of equity capital, and therefore the correlation or valuation line.
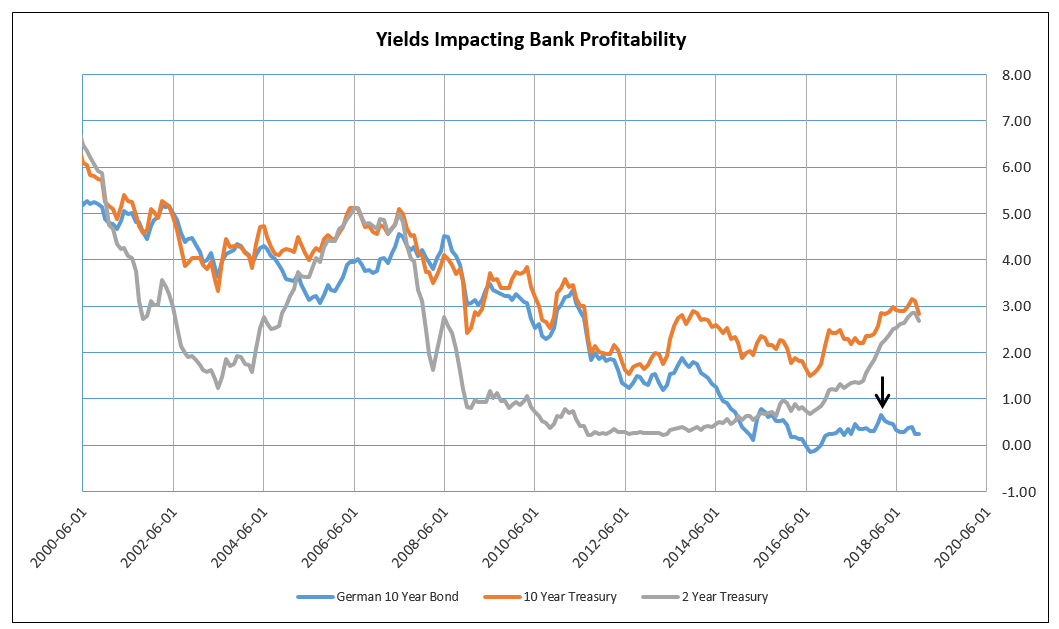
It is also important to note the downward shift in the valuation line on Chart I is similar to the lower valuation seen in the year 2015 through February 2016. The U.S 10-Year T-Note yields declined to 1.5% in 2015, as the German 10-Year fell to zero. Currently, the fall in the U.S. 10-Year Treasury yield to under 3% is due to the decline in the German yield to 0.23%. This decline in the U.S. T-Note yields as the Federal Fund rate is raised to 2.5%, limits book loan rates and raises deposit costs, reducing bank profitability. A reversal in German 10-Year Bond yields in 2019 and 2020 could provide an opportunity for bank stocks to return to normal valuations (see Chart I).
Chart I

U.S. Banks Profitability Held Hostage by the German 10-Year Yield
Chart II shows how U.S. 10-Year T-Note and German 10-Year Bond yields have performed similarly over time. Since 2015, the European Union and German central banks have been determined to maintain a near-zero yield on the German 10-Year Bond, in order to stimulate growth in the European economy. In early 2018, this Bond yield increased above 0.5%, providing the opportunity for the U.S. 10-Year T-Note yield to increase (see Chart II). However, in the last few months, German Bond yield has retreated to 0.23%. Despite the significant increase in yield in the U.S. 2-Year T-Note, the decrease in the German Bond yield has caused the U.S. 10-Year T-Note yield to retreat below 3%.
Chart II

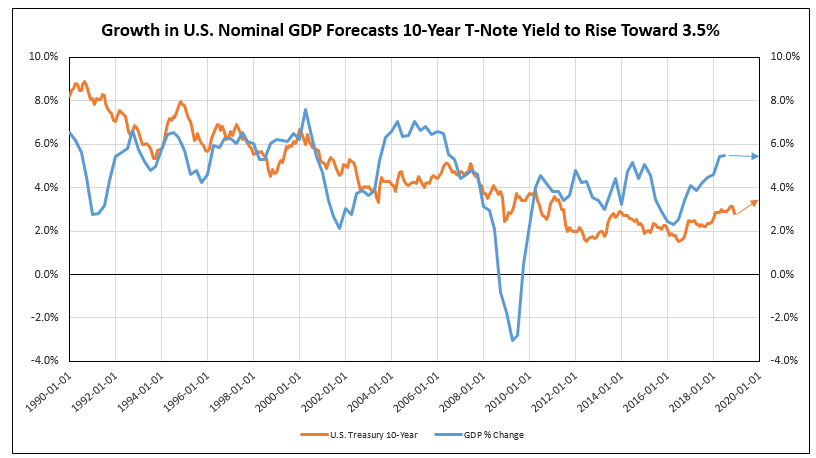
The German 10-Year Bond yield is primarily controlled by the European Central Bank. In 2019, the German economy is estimated to have 3.7% nominal GDP growth, paralleling nominal U.S. 4.5% GDP growth. The growth in U.S. GDP implies a rise in the U.S. 10-year Bond yield to 3.5% in 2019 (see Chart III). However, as part of the Euro currency, Germany’s economic growth is hidden, since it is averaged with weak growth of other countries included in the Euro. Despite its growing economy, Germany can use the Euro currency to maintain low prices.
Controlling the 10-Year Bond yield and the Euro Currency also allowed Germany the opportunity to take advantage of the U.S., with cheaper exports, reduced long-term interest rates, and high tariffs on U.S. exports to Europe. However, agreements between the EU and the U.S., as highlighted in new talks, could alter tariffs and free trade on manufactured goods, shifting some of this imbalance.
Chart III

To view all our products and services please visit our website www.idcfp.com.
For more information about our ranks, or for a copy of this article, please contact us at 800-525-5457 or info@idcfp.com.
John E Rickmeier, CFA, President, jer@idcfp.com
Robin Rickmeier, Marketing Director
