ROE vs. COE is the Best Indicator of Bank Stock Value
IDC Financial Publishing (IDCFP) measures relative profitability of bank holding companies by comparing the IDCFP return on tangible equity (NOPAT ROE) to our definition of the cost of equity (COE). Margin between ROE and COE (included in the “M” in IDCFP’s unique CAMEL analysis) is a key measure of management.
If the spread of ROE less COE is positive, or improving, management is creating value; the wider the spread, the greater the value. If the spread of ROE less COE is decreasing, or negative, management is destroying value. Bank value, in turn, is then determined by comparing its stock price to its tangible book value, i.e. equity market capitalization to tangible book value of common stock, versus the spread between ROE and COE to determine a bank’s valuation (see Chart I).
On 12/31/19 the long bond U.S. Treasury yield was 2.4% and the average COE for all large bank holding companies was 4.84%, with COE ranging from 3.52% for Raymond James Financial (RJF) to 6.36% for Bank of America Corp (BAC). As seen in Chart I, there is a high correlation between Market Capitalization/Tangible Book Common Equity compared to IDCFP’s spread of ROE less COE for large bank holding companies. This correlation demonstrates how COE, when defined by long-term U.S. Treasury yields and bank-specific risk, best determines cost of equity capital, and therefore the value correlation or valuation line.
Chart I
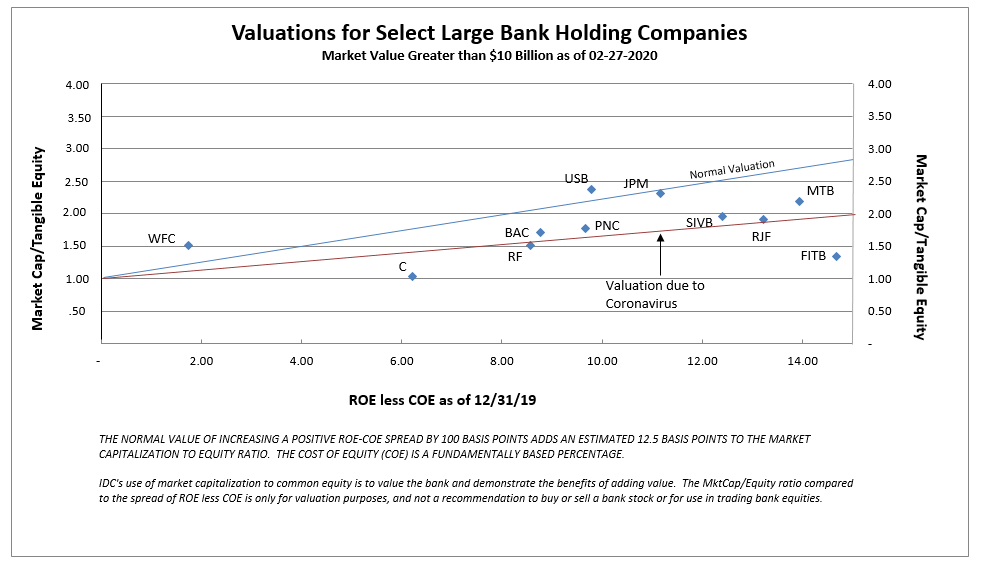
Effects of the Coronavirus
Bank holding companies’ common stocks are currently selling at a major discount to normal valuations due to the China coronavirus (see Chart I). Anticipated resolution of the virus later in 2020, and a return to a positive yield curve would indicate a substantial recovery in bank equities to normal valuations.
Recovery in Bank Stock Valuations
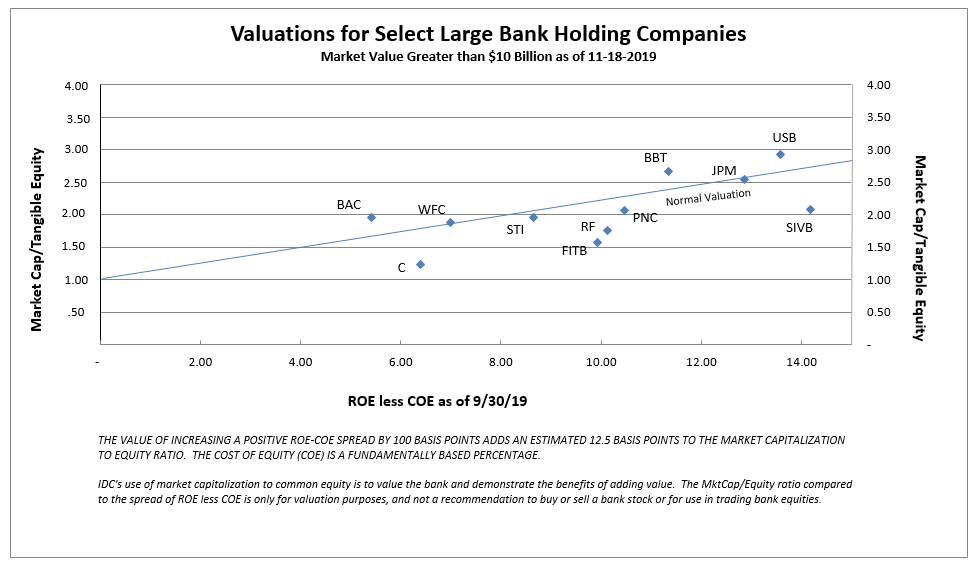
The inverted yield curve in 2019 caused bank stocks to sell at a discount to normal valuation. As illustrated in Chart II, most large banks on August 16, 2019 sold at a discount to the normal valuation line. The Federal Reserve corrected its 2018 rate hike errors, which peaked at 2.50% at year-end, with a series of rate reductions to the range of 1.75% to 1.50%. This provided a 1.51% T-Bill yield versus a 1.76% T-Note 10-year yield. The return to a positive yield curve created the recovery in bank stocks to normal valuations (see Chart III).
Chart II

Chart III
To view all our products and services please visit our website www.idcfp.com.
For more information about our ranks, or for a copy of this article, please contact us at 800-525-5457 or info@idcfp.com.
John E Rickmeier, CFA, President, jer@idcfp.com
Robin Rickmeier, Marketing Director