ROE vs. COE is the Best Indicator of Bank Stock Value
ROE vs. COE is the Best Indicator of Bank Stock Value
IDC Financial Publishing (IDCFP) measures relative profitability of bank holding companies by comparing the IDCFP return on tangible equity (NOPAT ROE) to our definition of the cost of equity (COE). Margin between ROE and COE (included in the “M” in IDCFP’s unique CAMEL analysis) is a key measure of management.
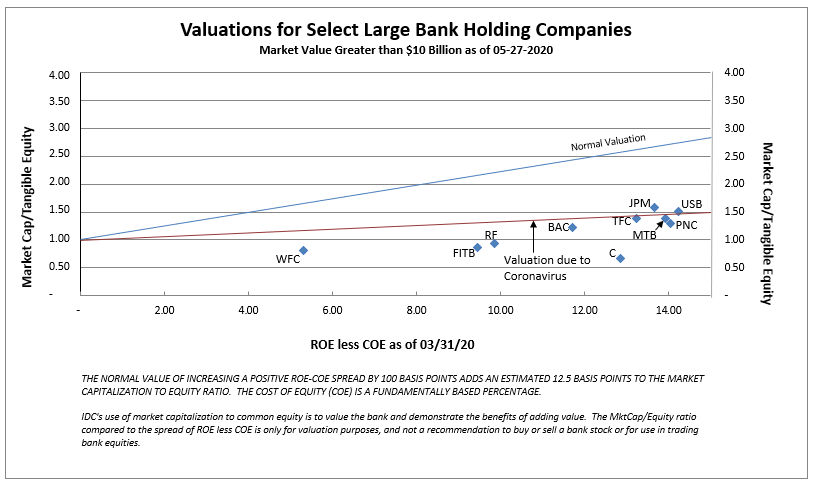
If the spread of ROE less COE is positive, or improving, management is creating value; the wider the spread, the greater the value. If the spread of ROE less COE is decreasing, or negative, management is destroying value. Bank value, in turn, is then determined by comparing its stock price to its tangible book value, i.e. equity market capitalization to tangible book value of common stock, versus the spread between ROE and COE to determine a bank’s valuation (see Chart I).
On 03/31/20 the long bond U.S. Treasury yield was 1.4% and the average COE for all large bank holding companies was 2.81%, with COE ranging from 2.28% for PNC Financial Services Group (PNC) to 3.59% for Bank of America Corporation (BAC). As seen in Chart I, there is a high correlation between Market Capitalization/Tangible Book Common Equity compared to IDCFP’s spread of ROE less COE for large bank holding companies. This correlation demonstrates how COE, when defined by long-term U.S. Treasury yields and bank-specific risk, best determines cost of equity capital, and therefore the value correlation or valuation line.
Chart I
The Impact of Covid-19 on Large Bank Stock Valuations
The best valuation method compares market common equity capitalization to tangible capital (price to book) versus the spread between return on tangible common equity (ROE) less cost of equity (COE). The latest reported ROEs are for the first quarter ending March 31st, 2020, reflecting a still-healthy banking system during the beginning of Covid-19. The COE, however, uses the long T-Bond yield as of March 31st, adjusted for individual bank risk, times half of the 30-year yield. The Federal Reserve cut the Fed Funds rate to zero by March 31st. The yield on the U.S. 30-year T-Bond reflected that, and foreshadowed economic weakness to come from Covid-19. Therefore, the spread between the high ROEs and low COEs were wide.
Low Valuations Between 1- and 1.5-Times Book Value Discount the Wider Spread
During the recovery phase from economic disaster caused by Covid-19,
- ROEs will decline and then recover in late 2020 into 2021.
- COEs are expected to rise, reflecting higher yields on 30-year T-Bonds later in 2020, and especially in 2021.
- Reduced ROE and higher COE narrows the expected spread for the high quality, large banks to 10%, down from 14% today.
- Valuations are expected to recover to normal levels to 2 to 2.5-times book value (see Chart I).
Favorable Large Bank Valuations on November 18, 2019
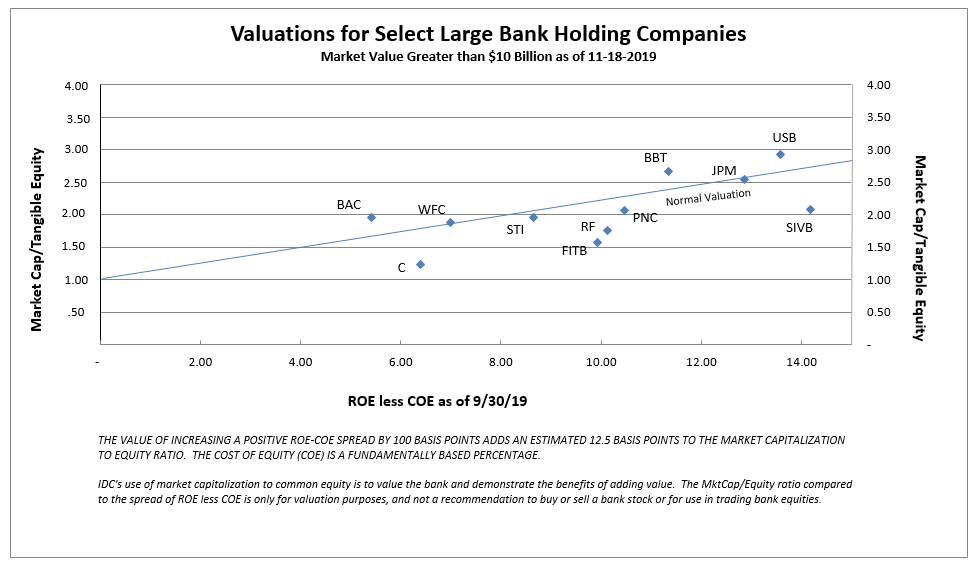
To understand the normal valuation line, Chart II shows the ROE from September 20th, 2019 and market valuation as of November 18th, 2019. Following the August 2019 low in bank stock valuations, we saw stock valuations that performed better and led the stock market recovery from August to November 2019. High quality, large bank stocks with spreads between ROE and COE of 10 to 14 percentage points sold as high as 2.66, and as low as 2.07 times tangible book value.
These high valuations and favorable ROE less COE spreads reflected a strong and healthy economy in 2019, with an optimistic outlook for 2020 - - all pre-Covid-19. The favorable valuations also provide a blueprint of the opportunity for a healthy banking system in 2021, following economic recovery in 2020.
Chart II
To view all our products and services please visit our website www.idcfp.com.
For more information about our ranks, or for a copy of this article, please contact us at 800-525-5457 or info@idcfp.com.
John E Rickmeier, CFA, President, jer@idcfp.com
Robin Rickmeier, Marketing Director