Banks Benefit from Multiple Forms of Leverage in an Economic Recovery
The combined effect of bank leverage forecasts a 54% price appreciation for the index of large banks (BKX) over the next year from the closing stock price on April 23, 2021.
Operating Leverage from an Increase in the Operating Return After Tax (ROEA)
ROEA is the operating return after taxes, but before funding cost (see IDFCP’s Methodology below). The ROEA for all bank holding companies was 2.03% as of year-end 2019, declined to a low of 1.37% in the third quarter 2020, and is forecast to recover to the 2.00% level by March 31, 2022. The forecast relies on the U.S. 10-year yield increasing to 2.4% in late 2021 (see Chart I). The continued rise in the 10-year to 3% by year-end 2023, raises the forecast of ROEA to 3% by December 31, 2023.
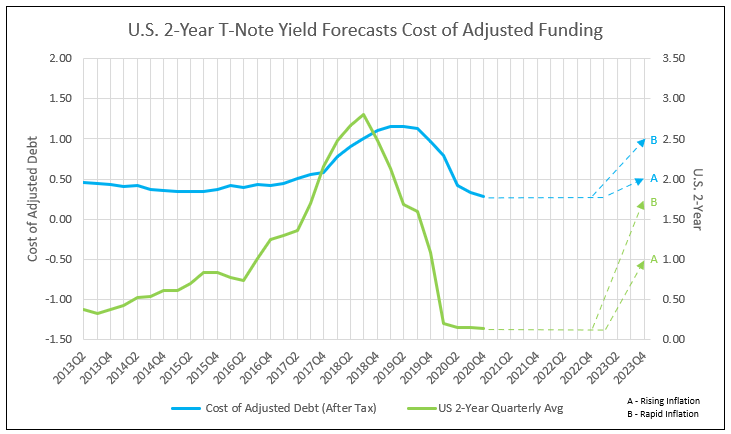
Leverage Spread Increases as the Cost of Funding Adjusted Debt Remains Low
The cost of adjusted debt from funding was 28 basis points as of December 31st and expected to remain in a range of 30 to 40 basis points until 2023. Controllable inflation forecasts a rise to 50+ basis points, while rapid inflation forecasts a recovery to 1%. The 2-year T-Note is used to forecast the bank cost of funding adjusted debt (Chart II). The leverage spread (ROEA less cost of adjusted deposits and debt) could recover from 1.16% on December 31, 2020 to a minimum of 1.5% over the next two years.
High Financial Leverage Enhances Return on Financial Leverage
Return on financial leverage (ROFL) is the result of multiplying the leverage spread times the leverage multiplier. The leverage multiplier is currently 10.9 times the leverage spread of 1.5%, and provides a ROFL of 16.4%, up from 12.3% at the end of 2020.
Both Operating and Financial Leverage Benefit the Bank Stocks in 2021, 2022 and 2023
Adding the rising operating return (ROEA) to the financial return (ROFL) provides a NOPAT ROE of 18.4% in 2022, up from 13.8% at year-end 2020.
Leverage from a Higher NOPAT ROE Less Cost of Equity Capital (COE) Drives a Rising Price to Tangible Book Value
Estimating appreciation potential for a bank stock requires a target price.
- Projection of tangible book value per share (TBVPS) one year into the future.
- Forecast of NOPAT ROE one year ahead.
- Forecast of cost of equity capital (COE) based on the 30-year T-Bond yield one year ahead, with COE adjusted for bank-specific risk.
- The spread between ROE and COE determines the projected price-to-book, which is multiplied by forecast TBVPS to calculate the target price.
The favorable ROE of 18.4% is offset by a rising cost of equity capital, due to the increase in the 30-year T-Bond yield. A 3% yield on the 10-year raises the 30-year to 3.8% and increases the cost of equity capital to 6%. The spread between NOPAT ROE and COE is 12.4%. In a fully valued bank stock market, like in February 2018 or December 2019, this spread prices a higher multiple of 2.4 times projected TBVPS. Up from a today’s multiple of 1.7, the projected 2.4 provides a 54% appreciation potential for the average bank by March 2022.
Due to these multiple forms of leverage in a recovering economy with rising yields, bank stocks outperform value stocks, as represented by the Russell 1000 value stock index. In past bull markets in bank stocks, IDC Financial Publishing (IDCFP) forecasts proved accurate. For example, the BKX* over 20 months, from 6/30/2016 to 2/22/2018, rose to 103.6% of the target price for February 2018. The price appreciation over 20 months was 97.1% and the forecast for the price appreciation was 92.0%. Our projection on the target price today uses the same process as in past years.
*Large Money Center, Regional and Credit Card Banks
Chart I
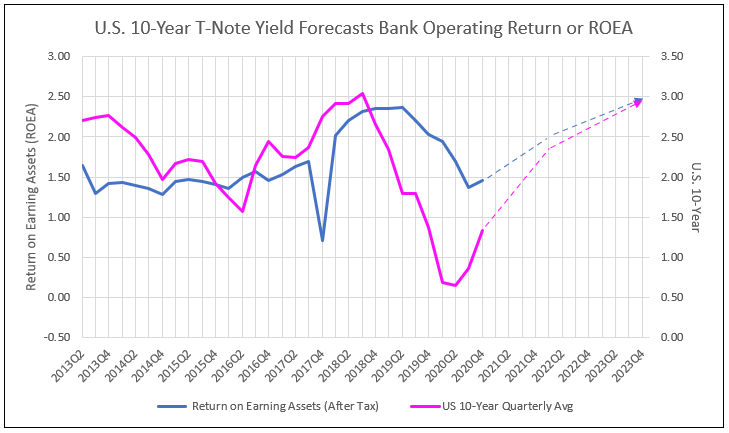
Chart II
Methodology:
The Traditional ROE Equation and the Problem with the Bank Stock Analysis
The traditional ROE equation simply divides net income by the average of common stockholder’s tangible equity capital. The stockholder ROE, as a bottom-line measure of profitability, fails to reflect the true nature of asset value. In addition, the traditional components of the ROE ratio – net interest margin, net income return on assets (ROA), and resulting stockholder ROE – confuse the source of net income by subtracting cost of funding so early in the analysis. Bank common stock evaluation is unable to separately compare operating and financial returns. Also, accounting for the loan loss provision, and not adjusting net income for the increase on the loan loss reserve, fails to reflect the true cash flow to earnings.
The NOPAT ROE Equation and ROEA, a Measure of Operating Returns
In contrast (IDCFP) uses the NOPAT ROE equation to express ROE as a sum of two components, operating return (ROEA) and financial return (ROFL). ROEA equals the return that the bank earns on loans, securities, cash equivalents and other earning assets, after operating expenses and taxes, but before the loan loss provision and interest expenses on the deposit and debt funds. ROEA focuses on the operating strategy, which identifies returns from investments, loans, and non-interest income sources net of expenses and taxes, plus the increase in the loan loss reserve, all as a percent of earning assets.
Return on Financial Leverage (ROFL), a Measure of Financial Returns
The second component is the bank’s return on financial leverage (ROFL). This reflects both the degree to which the bank uses deposit and debt funds to finance its operating strategy and the cost of these debt funds. A bank’s return on financial leverage (ROFL) measures the efficiency with which the bank uses deposits, borrowings, and other forms of debt to leverage or fund earning assets, not funded by tangible equity capital and the loan loss reserve. ROFL is the product of the bank’s ‘leverage spread” and “leverage multiplier.”
The leverage spread is the difference between the after-tax ROEA and the after-tax cost of funding. The after-tax cost of funding equals interest expenses divided by the net adjusted debt.
Adjusted debt (equal to total earning assets less tangible equity capital and the loan loss reserve) is the remaining amount of earning assets funded by deposits, borrowings, or other debt. The leverage multiplier is the ratio of adjusted debt divided by the sum of tangible equity capital and the loan loss reserve.
The addition of the operating return (ROEA) plus the financial return (ROFL) equals the net operating profit (after tax) return on equity (NOPAT ROE).
For a more detailed graphic of IDCFP’s Common Stockholder Net Operating Profit (After tax) ROE Equation click here.
To view all our products and services please visit our website www.idcfp.com.
For more information about our Deposit Database, or for a copy of this article, please contact us at 800-525-5457 or info@idcfp.com.
John E Rickmeier, CFA, President, jer@idcfp.com
Robin Rickmeier, Marketing Director