The Long Bull Market in Bank Stocks
Rising German 10-year yields forecast increasing U.S. TIPS yields. This increase in TIPS yields, combined with the copper-to-gold ratio, forecasts a 2.4% yield on the U.S. 10-year T-Note by the end of 2021, 2.8% in 2022 and 3.2% in 2023.
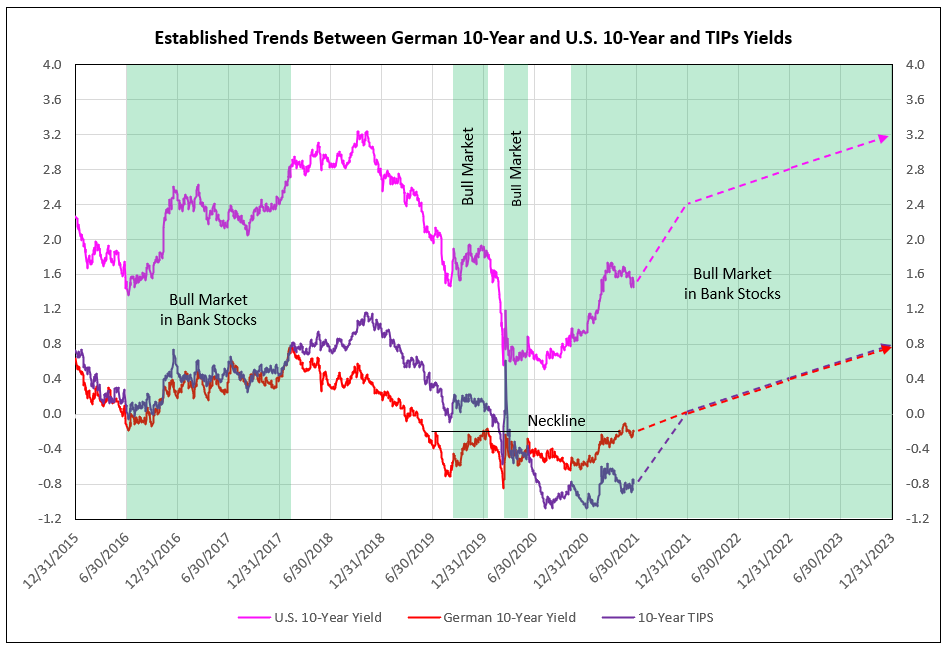
The U.S. 10-year is expected to rise significantly, led by the breakout of the German 10-year yield from its inverse head-and-shoulder pattern from 2019 to date. The German 10-year broke out to -0.07% recently and is forecast to rise to zero by year-end 2021, then +0.40% in 2022, and +0.80% in 2023, leading to U.S. nominal 10-year T-Note increases (see Chart I).
Chart I
The Relationship Between U.S. and German Yields
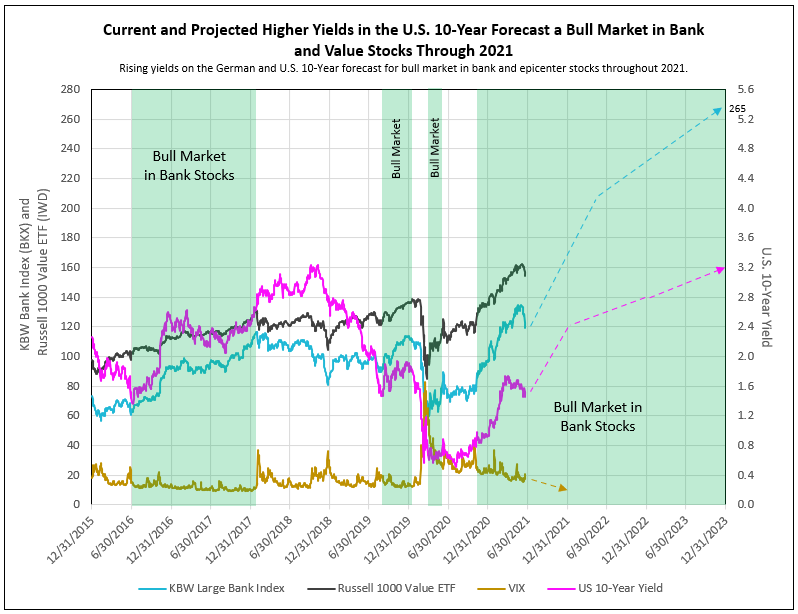
From June 2016 to February 2018, the US 10-year tips yield was equal to the German 10-year yield during a prolonged economic recovery and bank bull market. Rising German, U.S. nominal and TIPs yields favored the bank stocks (see Chart II).
Beginning in February 2018, the Federal Reserve began to aggressively raise the Fed Funds rate, while Trump tariffs on Chinese goods reduced German exports. Despite rising US yields on the 10-year, German yields declined significantly, as the Bundesbank attempted to protect German industry from the effects of tariffs.
The prolonged decline in German 10-year yields finally reached a low in August 2019, which began the next bull market in bank stocks. The German 10-year closed the gap with the U.S. TIPs yield into early 2020 (see Chart II).
Chart II
Impacts from Covid-19 and Resulting Fed Action
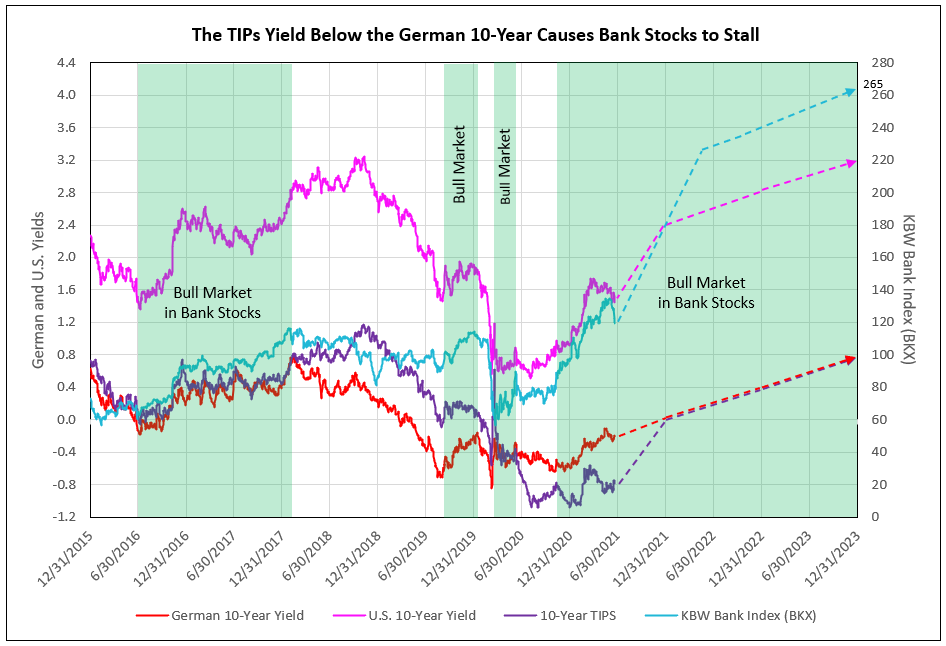
Then Covid appeared in February 2020, shutting down the economy, and resulted in Fed monetary stimulation. Initially, the tips yield fell to equal the German 10-year from March to early May 2020, providing the next bull market in bank stocks. The TIPs yield, however, continued to decline below the German 10-year, causing bank stocks to stall (see Chart II).
Finally, the German 10 year reached it low in October 2020, completing the right shoulder of the inverse head and shoulder pattern, beginning the current bull market in bank stocks. In May 2021, the German 10-year yields continued its recovery, breaking out of the neckline of the reverse head and shoulder formation. Initially, in the first quarter of 2021, the U.S. TIPs yield rose and narrowed the spread to the German 10-year. However, a short covering rally in U.S. Treasuries occurred. A huge short position in U.S. Treasuries, in view of expected inflation, was offset by massive purchases of Treasuries, as pension managers sold equities to purchase bonds in order to insulate their recent 100%-funded pension position. The short covering was reflected in a peak in the price of the 20-year Treasury Bond ETF (TLT) and raised the 14-day relative strength index to a peak 69% on June 11, a level not seen since early August 2020, which also forecast a peak in price and rise in yields.
Continued Recovery Drives Higher Yields
In economics, there remains a natural affinity to have the U.S. 10-year tips yield equal the German 10-year yield. Rising TIPS yields with implied inflation of 2.4% forecasts the nominal 10-year to increase to as much as 2.4% by year-end 2021, 2.8% by the end of 2022, and 3.2% by year-end 2023. This forecast interest rate environment is difficult for growth stocks, but highly favorable for reopening epicenter, value and, especially, bank stocks.
Continued strength in the U.S. and world economies in the next 30 months drives higher TIPS yield, rising toward the German 10-year yield. The resulting rise in the nominal U.S. 10-year yield in 2021, 2022, and 2023 forecasts a continuing bull market in bank stocks.
The IDC Financial Publishing (IDCFP) bank stock model forecasts a 64% appreciation potential in the BKX bank stock index (large money-center, regional and credit card banks), from 128 to 210 projected for 2022Q2. In 2023, we forecast another 26% appreciation potential of the BKX, from 210 to 265. In total, this creates the bank bull market, and a BKX appreciating from 128 to 265, or 107% potential, over 30 months (see Chart II).
The Copper-to-Gold Ratio Provides a Second, Confirming Forecast
The recent rally to all-time highs in copper raised the U.S. price to a peak of $4.89. The price surge reflects stimulus measures, vaccine rollouts and pledges for climate change reform, which combined, are fueling global recovery from the pandemic. Copper underpins the rally in metal markets from aluminum to iron ore.
With copper demand set to soar once more, there are mounting concerns that producers will struggle to fill the gap as they attempt to overcome a host of technical and regulatory pressures. Port workers in Chile, the top producers of copper, are protesting the government’s pandemic relief policies. Producers worry that plans to raise mining royalties could stifle investment and make the country less competitive. World demand compared to supply, once Covid-19 recedes in foreign countries, points to rising copper prices, reaching as high as $5.50 in 2022 or 2023.
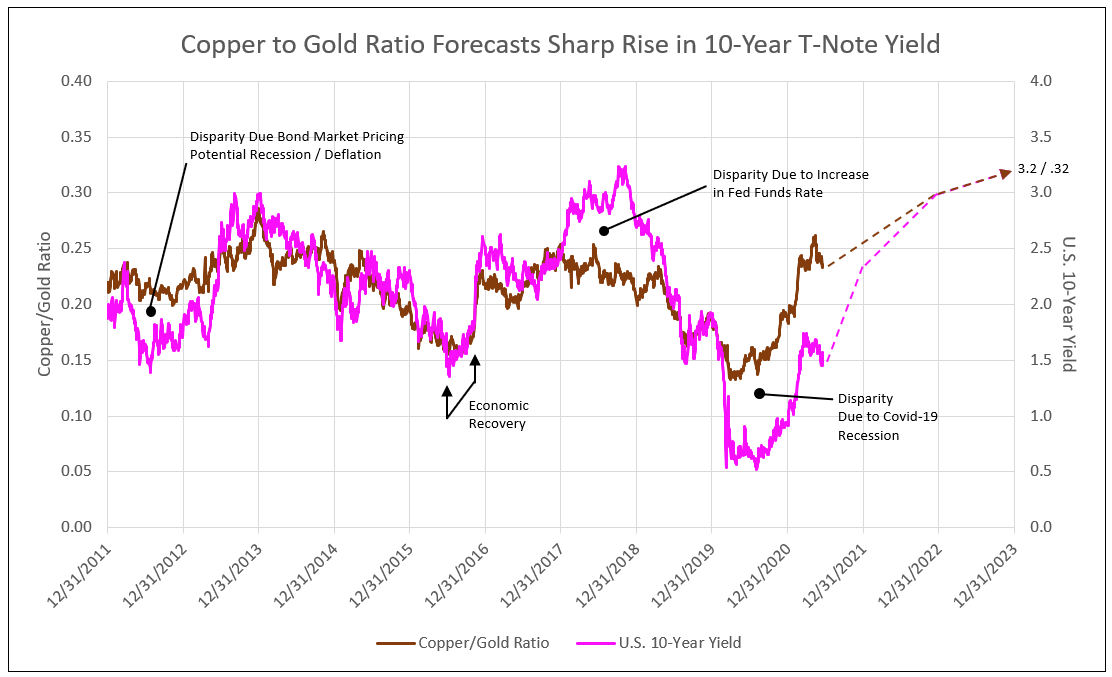
The copper-to-gold ratio is highly correlated to the U.S. 10-year yield since 2015. A disparity occurred in 2012 and 2013, as the bond market priced potential recession / deflation. The subsequent change in sentiment to recovery / inflation returned the 10-year yield to correlation to the copper-to-gold ratio.
A second disparity occurred in 2018 and the first half of 2019 due to the Federal Reserve increasing the Federal Funds rate beyond levels required, lifting the 10-year yield above the 2.5% level forecast by the copper-to-gold ratio. Correlation resumed in the second half of 2019.
The third disparity from February to July 2020 was due to Covid-19, the lockdowns and resulting economic recession. Since July 2020, the spread between the copper-to-gold ratio and the 10-year yield narrowed, as the copper-to-gold ratio rose from a low of 0.14 to above 0.20, forecasting a recent steady rise in the 10-year yield from 0.5% to the recent peak of 1.7%. The current ratio of 0.24 forecasts the potential for the 10-year T-Note yield to rise to 2.4% by year-end 2021.
The significant and sharp recovery in the 10-year yield is also due to the anticipation of successful vaccinations and potential herd immunity to Covid-19. This indicates a marked recovery in the U.S. economy with a commensurate and sustained level of inflationary expectations at around 2.4%. A high-end increase in 2023 in the copper price to $5.50 and gold falling to $1,700, provides a 0.32 ratio of copper-to-gold, or a forecast of a 3.2% yield on the 10-year T-Note in 2023 (see Chart III).
Chart III
Many analysts use this ratio to forecast yields, and, when combined with other evidence, supports this projection as listed in the following observations.
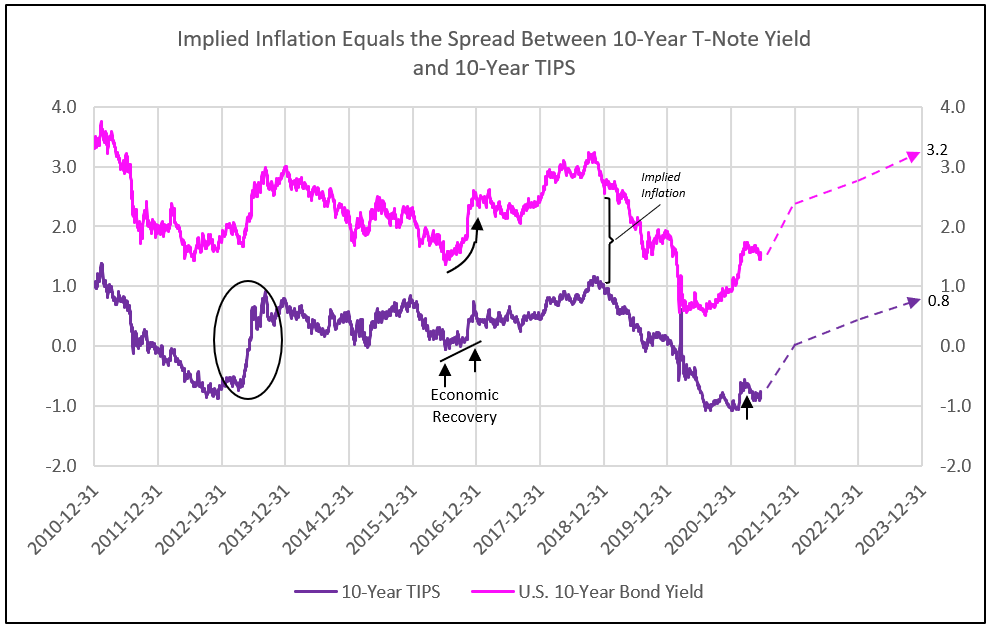
- The 10-year TIPs yield climbs to zero in 2021, raising the nominal yield to 2.4%, and implying 2.4% 10-year inflation. The TIPs yield reaches 0.4%% by year-end 2022, and 0.8% in 2023, raising the normal yield to 2.8% in 2022 and 3.2% in 2023.
Similar to 2013, a change in outlook from recession / deflation to recovery / inflation lifts the 10-year real yield (TIPs) to zero from the recent lows of -0.9%. Recent implied inflation rose to 2.4%. The higher 10-year TIPs yield of zero by the end of 2021 raises the nominal yield to 2.4%. Further gains in the TIPs to 0.4% in 2022 and 2.4% implied inflation forecasts a 2.8% nominal 10-year yield by year-end 2022. A further rise in TIPS to 0.8% in 2023 projects a 3.2% nominal 10-year yield (see Chart IV).
- Economic recovery also lifts yields higher, as was the case in 2016.
The impact of economic recovery, with a 100-basis point rise in the TIPs yield, raised 10-year nominal yields in 2016 (see Chart IV). The combination of the sentiment shift of 2013 in the TIPs yield, and economic recovery in 2016, together, forecast significant yield increases for 2021, 2022, and 2023 in the U.S. 10-year.
Chart IV
The Major Beneficiaries of a Rising 10-Year Yield and Low Short-Term Treasury Yields are the Large Banks, Offering a 64% Appreciation Potential Over the Next Year in the BKX Index
Economic recovery, following the battle against Covid and resulting recession, provide two key ingredients that benefit banks:
- A strong economic recovery in GDP of 6% to 8% in 2021 provides 6% to 8% loan growth in the second half of 2021, and into 2022 and 2023.
- A rise in the 10-year to 2.4% by fall of 2021, and to 3.2% in 2023, with a low 2-year T-Note yield, widens the spread between bank’s loan yields and deposit costs.
In addition to bank stocks, the major beneficiaries of the economic recovery, with the Federal Reserve stimulus controlling short-term rates and the fiscal policy stimulus from Federal Government spending, outperform the average of epicenter and value stocks (see Chart V).
Inflation concerns have grown among economists as prices have risen in several sectors. The Fed indicated this week that they plan to hike some interest rates sooner than they had previously estimated. JPMorgan Chase CEO Jamie Dimon says to expect to see higher rates and more inflation, The company is preparing for these events by essentially hoarding cash as it waits for interest rates to go up.1
Chart V
1 - mediaite.com, Jamie Dimon Says...There’s a ‘Very Good Chance’ of Long-Term Inflation
To view all our products and services please visit our website www.idcfp.com. For more information about our ranks, or for a copy of this article, please contact us at 800-525-5457 or info@idcfp.com.
John E Rickmeier, CFA, President, jer@idcfp.com
Robin Rickmeier,
Marketing Director