The Profit Structure of Banking Improves Dramatically
The decline in the TIPS 10-year yield to -1.0% reduced the 10-year nominal yield to 1.35%. The delay in the expected increase in the TIPS to 0.4% and nominal to 2.0% reduces the 1-year forecast for appreciation potential for large banks to 57% from the initial estimate of 68%, based on a new target of 190 for the BKX large bank index.
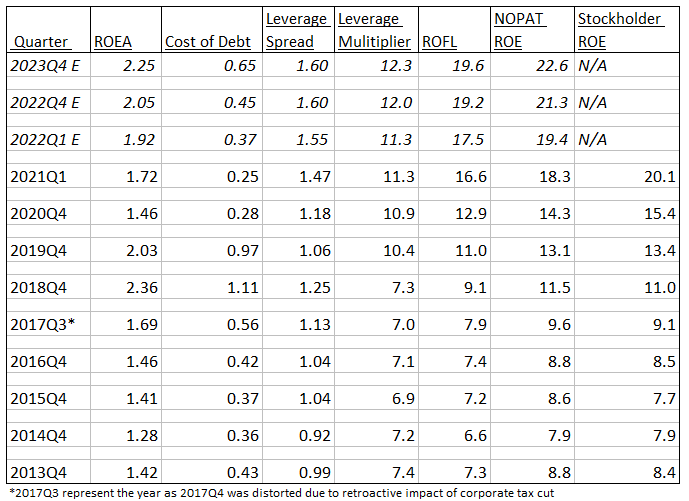
Return on Equity (ROE) defines the profit structure of the banking industry. ROE is defined by IDC Financial Publishing (IDCFP) as the addition of return on earnings assets (ROEA) and return on financial leverage (ROFL), or operating return plus financial return.
ROEA equals all operating income, less operating expenses (before funding costs) after-tax, excluding the loan loss provision, but adding back the increase in the loan loss reserve, to capture operating performance. Operating returns experienced a rising trend over the past decade. ROEA rose from an all-bank average of 1.46% in 2016 to a peak of 2.37% in June of 2019 and ended 2019 at 2.03%. Covid-19 impact last year reduced ROEA to 1.37% in September of 2020, but it is expected to recover to 1.92% by the first quarter of 2022, then to as high as 2.05% by year-end 2022 and 2.25% in 2023.
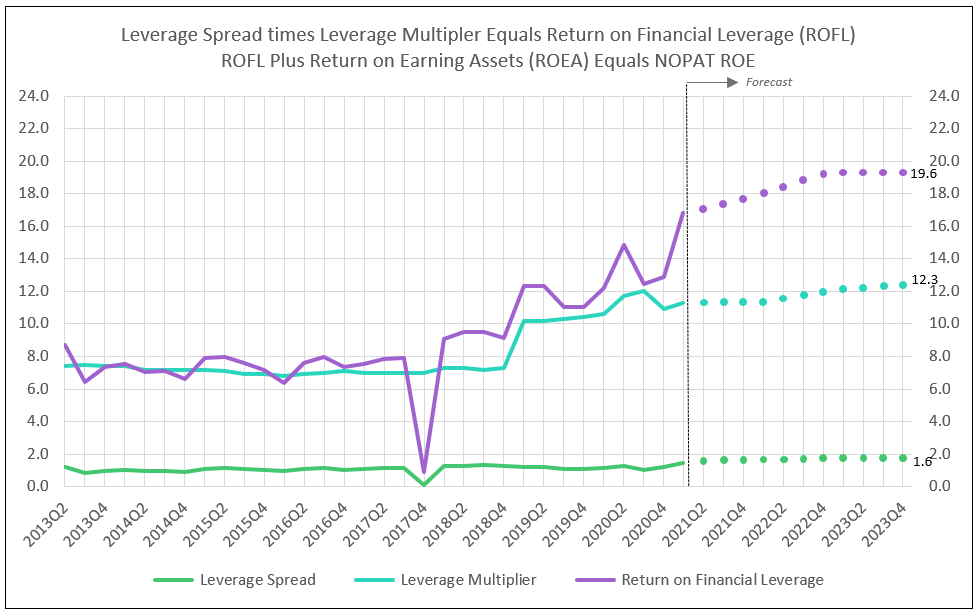
Return on Financial Leverage (ROFL) experienced a dramatic acceleration from 7.4% in 2016 to 16.6% in early 2021. ROFL in a function of the leverage spread times the leverage multiplier. Leverage spread is the above described ROEA less the interest cost of adjusted debt, after tax. Leverage multiplier is the ratio of adjusted debt divided by the sum of tangible equity capital and the loan loss reserve. Adjusted debt equals the amount of earning assets not funded by tangible equity capital and the loan loss reserve.
While ROEA grew from 1.46% in 2016 to 1.72% in the first quarter of 2021, cost debt rose from 0.42% in 2016, to a peak of 1.16% in early 2019, but fell to 0.25% in 2021 due to Covid-19 and Federal Reserve policies. As ROEA recovers in 2021 through 2023, cost of debt will increase to 0.37%, then to an estimated 0.45% and 0.65% during the same period. Leverage spread, therefore, increases to 1.55% in the first quarter of 2022, and to 1.60% in 2022 and 2023 (see Table I and Charts I, II and III).
The key change in the last 5 years was the increase in the leverage multiplier from 7.1 in 2016 to 11.3 in the first quarter of 2021 (see Chart III). The significant rise in leverage, multiplied by an improving leverage spread, dramatically increased ROFL from 7.4% in 2016 to 16.6% in early 2021. Adding the ROEA to ROFL provided an increase in profitability (ROE) from 8.8% in 2016 to 18.3% in the first quarter of 2021. In the same period, stockholder ROE rose from 8.5% to 20.1%.
NOPAT ROE (ROEA + ROFL) measures the true cash flow return on tangible equity and the loan loss reserve. Stockholder ROE calculates profitability adjusted for loan loss expense changes to forecast risk. Using NOPAT ROE, the forecast for 2022 through 2023 improves with a ROE to 19.4% in early 2022, then 21.3% by year-end 2022 and 22.6% in 2023.
As tangible equity per share grows at more than 10% and ROE increases from 18.3% to 22.6%, earnings per share growth accelerates. This earnings per share acceleration with a terminal p/e ratio of 14-times, provides the substantial appreciation potential through 2023, a long bull market in bank stocks.
Earnings Analysis
Bank holding companies’ earnings reported for the first quarter 2021 were $86.4 billion. In computing NOPAT ROE by IDCFP, only the increases in the loan loss reserve are included in the net income. Therefore, the net releases from the loan loss reserves are not included in the NOPAT ROE, or IDCFP calculations, but do aid in increasing TBVPS. In shareholder ROE, reductions in the loan loss reserve are included in earnings and amounted to an estimated $7.6 billion in the first quarter of 2021.
Table I
Total of Bank Holding Companies One-Quarter Calculated Ratios - Asset Weighted Averages
Banks Benefit from Multiple Forms of Leverage in this Economic Recovery
The combined effect of bank leverage forecasts a 57.2% price appreciation based on a revised target price of 190 for the index of large banks (BKX) over the next year, and additional appreciation for the remainder of 2022 and the year 2023.
Leverage from a Higher NOPAT ROE Less Cost of Equity Capital Drives a Rising Price to Tangible Book Value
Estimating appreciation potential for a bank stock requires a target price.
- Projection of tangible book value per share (TBVPS) one year into the future.
- Forecast of NOPAT ROE one year ahead.
- Forecast of cost of equity capital (COE) based on the 30-year T-Bond yield one year ahead, with COE adjusted for bank-specific risk.
- The spread between ROE and COE determines the projected price-to-book, which is multiplied by forecast TBVPS to calculate the target price.
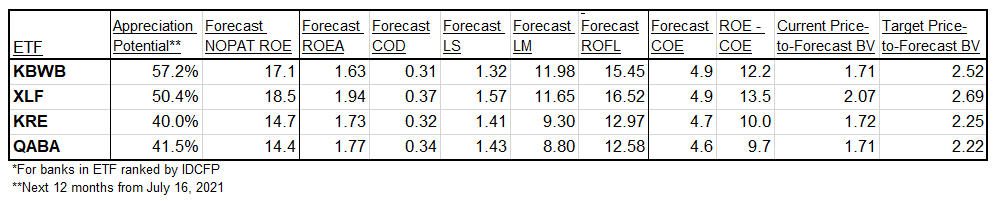
Below are a variety of bank ETFs with market capitalization weighted NOPAT ROE estimates and their respective components. Subtracting the forecast cost of equity capital of 4.9% provides the ROE less COE spread. The spread determines the estimated target price to the forecast TBVPS, compared to today’s price to the forecast TBVPS.
Table II
Forecast of Appreciation Potential from Forecast ROE and COE - Market Capitalization Weighted Averages*
Tables Glossary:
NOPAT ROE: ROEA + ROFL
ROEA: Return on Earning Assets (before funding costs and after tax)
COD: Cost of Adjusted Debt (after tax)
LS: Leverage Spread
LM: Leverage Multiplier
ROFL: Return on Financial Leverage
COE: Cost of Equity
ROE - COE: Determines target price-to-forecast tangible book value
IDCFP’s Forecast Process
Due to these multiple forms of leverage in a recovering economy with rising yields, bank stocks outperform value stocks, as represented by the Russell 1000 value stock index. In past bull markets in bank stocks, IDC Financial Publishing (IDCFP) forecasts proved accurate. For example, the BKX* over 20 months, from 6/30/2016 to 2/22/2018, rose to 103.6% of the target price for February 2018. The price appreciation over 20 months was 97.1% and the forecast for the price appreciation was 92.0%. Our forecast for the target price today uses the same process as in past years. *BKX: Large Money Center, Regional and Credit Card Banks
For a more detailed graphic of IDCFP’s Common Stockholder Net Operating Profit (After tax) ROE Equation please contact us. Individual bank valuations also available upon request.
Chart I
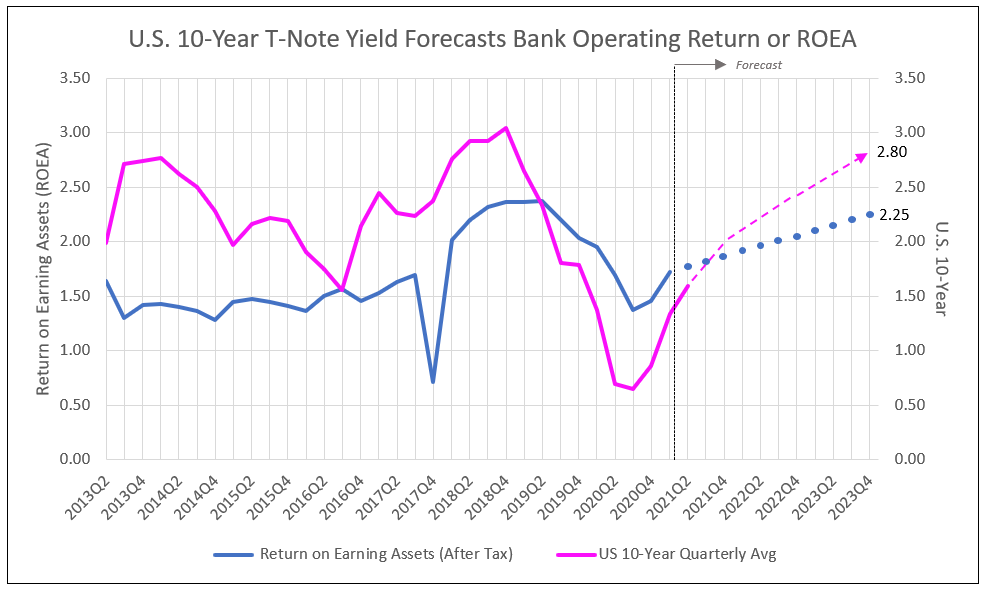
Chart II
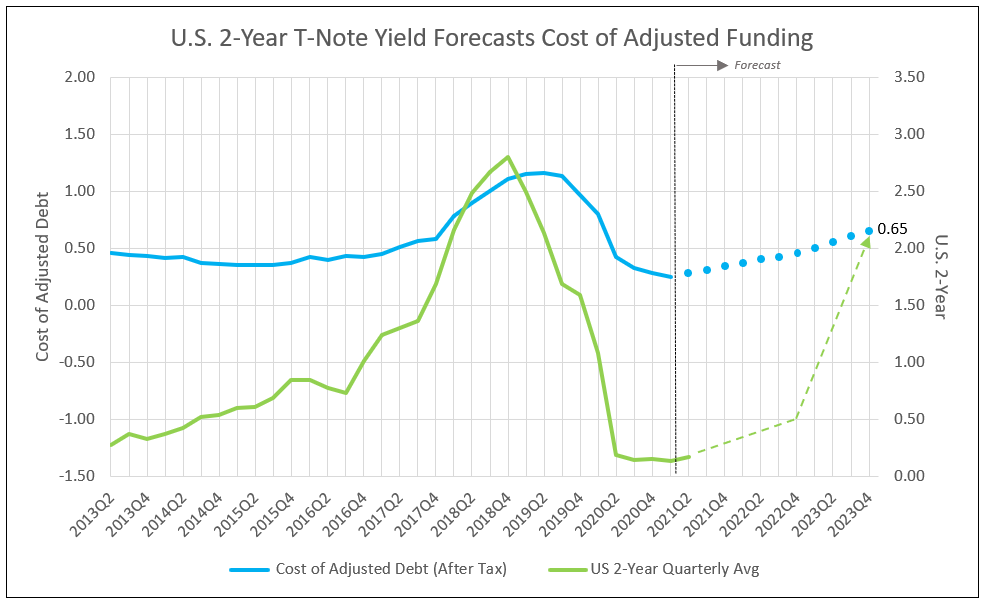
Chart III
General Disclosure
IDC Financial Publishing, Inc. is an independent research company and is not a registered investment advisor and is not acting as a broker-dealer under any federal or state securities laws.
Opinions and estimates constitute our judgment as of the date of the material and are subject to change without notice. Past performance is not indicative of future results. This material is not intended as an offer or solicitation for the purchase or sale of any financial instrument, nor does it constitute investment advice or address the suitability of any investment or security. The opinions and projections herein do not take into account individual client circumstances, risk tolerance, objectives, or needs and are not intended as recommendations of particular securities, financial instruments or strategies. The recipient of this report must make its own independent decision regarding any bank analysis mentioned herein.
All research reports are disseminated and available to all clients simultaneously through electronic publication on the IDCFP portal or by email.
Copyright
© 2021 IDC Financial Publishing, Inc.
To view all our products and services please visit our website www.idcfp.com.
For more information about our ranks, or for a copy of this article, please contact us at 800-525-5457 or info@idcfp.com.
John E Rickmeier, CFA
President
jer@idcfp.com
Robin Rickmeier
Marketing Director