The End of TGA Runoff and Proposed Tapering of QEs Raise 10-Year Yields
From May to September 2021, reductions in the Treasury General Account at the Fed (TGA) balances created excess liquidity. Coupled with growth in the Fed’s balance sheet, together, caused yield declines on longer term treasuries from May to July 2021. This stimulus, however, is in the process of ending. TGA is below $200 billion (a return to normal balances), forcing the Treasury to finance new government spending, and the Fed is about to taper; both will increase longer term yields and widen the yield curve.
Chart I
Huge Runoff of U.S. Treasury Balance at the Fed Created Excess Liquidity

The balance in the Treasury General Account at the Federal Reserve Bank of New York plunged by nearly $100 billion over the past seven days, to $174 billion, as of Wednesday evening.1
“In mid-September, thanks to quarterly estimated tax payments, the TGA balance rose for one week, but not nearly enough. You see where this is going: $174 billion isn’t much of a cushion when $100 billion flow out in a week, and the government is barred from borrowing new money.”
“The TGA has been through some huge distortions. In the spring 2020, the Treasury Department issued $3 trillion in new debt to fund the tsunami of stimulus and bailout programs, but didn’t spend all of it, and the unused cash accumulated in the TGA. In January 2021, the Treasury Department began drawing down the TGA by reducing the amounts it borrowed to bring the account back to the normal range by summer.”
“Among the side effects of the massive drawdown of the TGA, from $1.6 trillion in January to near zero in a week or two, is a tsunami of cash for the economy and markets. This cash in the TGA was raised by the government via selling Treasury securities that the Fed gobbled up in the spring. And this cash just sat in the checking account until the government began drawing down the TGA earlier this year. It distributed this cash without having to borrow it. This was effectively a massive bout of delayed QE, which flooded the economy and markets with $1.4 trillion in cash so far this year.” 1
This huge liquidity injection into the markets helped boost asset prices and reduce the yield on the 10-year T-Note to a low of negative 1.19% in August 2021.
Chart II
Excess Liquidity in the Second Quarter 2021 Created by Reductions in TGA and Continuing QE, Caused the Fed to Accelerate Reverse Repos to Mop Up Liquidity
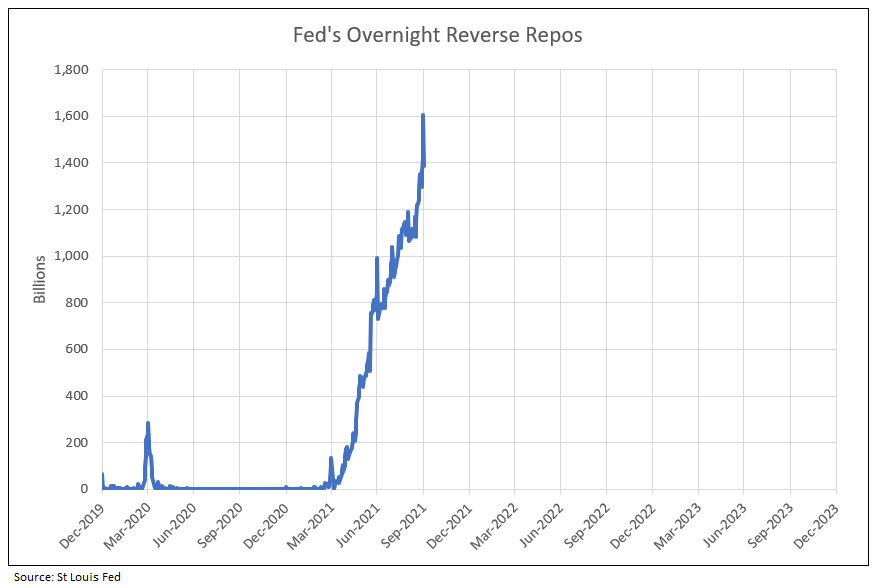
Overnight reverse repos (RRPs) are interest-bearing overnight loans by the counterparties to the Fed. They are an indication of the huge amount of excess cash in the financial system, which is the result of the Fed’s $4.6 trillion in money printing since March 2020. 2
RRPs have the opposite effect of quantitative easing (QE). The Fed creates cash and buys securities with that cash in the instance of QEs, but with RRPs the Fed sells (or lends out) securities, absorbing and removing cash from the financial system for the term of an RRP. 2
The Fed raised the interest rate that it pays on RRPs in June from 0.0% to 0.05%. Short-term Treasury yields were dipping into the negative because of too much cash in the financial system at the time. By raising the interest on RRPs to 0.05%, the Fed nudged up short-term Treasury yields into the positive. It was designed to keep one-month to six-month Treasury yields above 0%. The Fed has stated many times that it is going to avoid negative yields, unlike other central banks.2
“The purpose of the Fed’s RRP facility is to mop up the excess liquidity that the Fed has created.” The sharp decline in the TGA to normal levels under $200 billion indicates an end to the non-financing period with the Treasury again using the debt market to finance future spending. RRP transactions are happening overnight that affect short-term markets. The Fed keeps short-term rates above 0% but ending the drain in TGA, and unwinding QE, would raise long-term yields.2
Chart III
Tapering: Reducing the Growth in the Fed Balance Sheet to Zero or Less from November 2021 to June 2022 and Into 2023
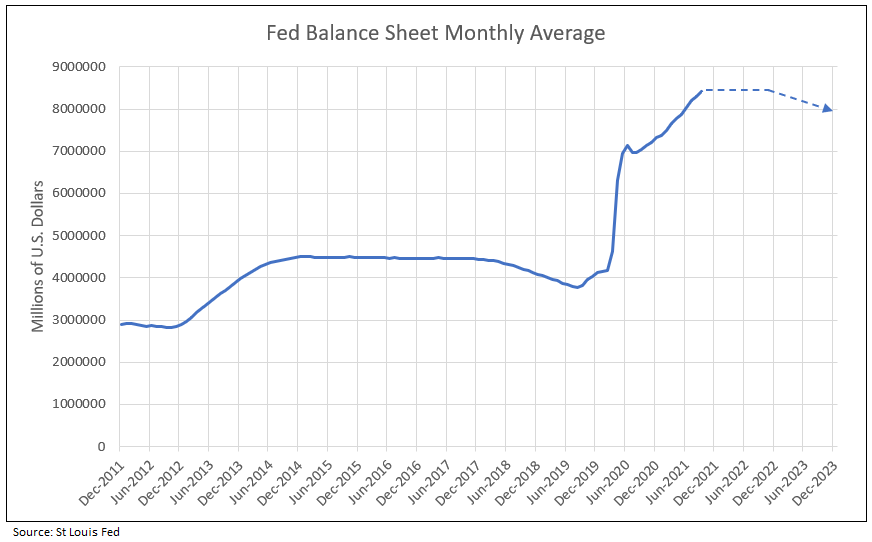
QE is the Other Part of the Problem
After having already bought $4.6 trillion in securities, the Fed continues to buy $120 billion a month. This piles on top of the cash already clogging the financial system, so RRPs are one way to ram down on this enormous liquidity unleashed by QE and the reduction of TGA.2
When the Fed ends its asset purchases in the first half of 2022, it should immediately start reducing the asset on its balance sheet, and let “maturing bonds roll off without replacement,” said Fed president James Bullard in an interview with Reuters.3
While Bullard didn’t say this specifically, a reduction in assets on the balance sheet would allow long-term yields to rise. With short-term rates still locked in place, the yield curve would steepen, allowing the Fed to raise short-term rates without flattening the curve.3
For months, Bullard has been fretting about the “threatening housing bubble” being fueled by the Fed’s massive purchases of mortgage-backed securities. He expects inflation, as measured by core PCE, to remain at 2.8% at year-end 2022, well above the Fed’s target of 2.0%. Most recently, Core PCE hit 3.6%, the highest since 1991. 3
“The exact start date and pace of tapering of the asset purchases hasn’t been announced in the FOMC statement yet, but will likely happen at the next meeting on November 3. Fed governors have come out and supported a start of tapering in November and be done with it in the first half – at which point, no new bonds would be added, and only maturing bonds would be replaced, which would keep the Fed’s assets flat. That would be the completion of tapering.”3
Bullard proposes the actual reduction of the balance sheet, of which assets would be around $8.5 trillion by the time the Fed ceases adding to them, and Bullard thinks there was no reason to hold on to them. While the FOMC has yet to begin discussions, Bullard doesn’t think it’s too early, given the speed of the economic recovery and concerns around inflation. 3
Even with a steep rise to 2.4% by March 2022, 10-year Treasury yields will likely remain below the rate of CPI inflation. Therefore, “real” Treasury yields would stay negative, while 10-year TIPs recover to zero, given pricing 2.4% implied inflation over 10 years (nominal minus TIPs yields).
Chart IV
Year to Year Growth in Fed Balance Sheet Declined in 2021, but Temporarily Recovered from May to August

The Impact of the End of Runoff of TGA and Tapering of QE Indicates Recovery in 10-Year Yields and Strongly Favors Bank Stocks
The current bull market in bank stocks began in Oct 2020, paused from May to September 2021, and is about to resume its upward trend into 2022.
Major increases in the 10-year TIPs yields in the second quarters of 2013, 2015 and 2016 provided a sharp rise in bank stock prices. The current increase in yields began July 19, 2021, and, importantly, supported by a recovery in German 10-year yields. The reversal and rise in the German 10-year from lows in August 2019, March 2020, October 2020, and July 2021 began a major increase in prices of bank stocks (see Chart V).
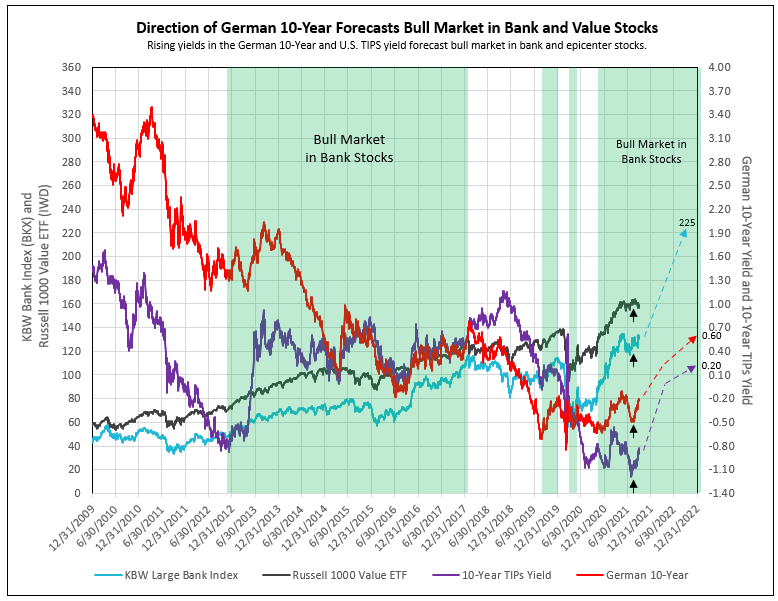
Chart V
1) Rise in 10-year yield at year-end 2012 begins Bank Bull Market
2) Peak and decline in German 10-year yield in February 2018 ends Bank Bull Market
3) Low and reversal in German 10-year yield in August 2019, March 2020, October 2020, and July 2021 began recovery in Bank Stocks
1 - Treasury General Account Plunges by $100 Billion in One Week. How Close to Zero Will it Get?, Wolf Street, Sept. 30, 2021
2 - As Overnight Reverse Repos Spike to Record $1.28 Trillion, Fed Doubles Per-Counterparty Limit, Keeps Adding Counterparties, Wolf Street, Sept. 22, 2021
3 - When Fed Doves Get Hawkish…, Wolf Street, Sept. 28, 2021
To view our products and services please visit our website athttp://www.idcfp.com. For more information about our services, or for a copy of this article, please contact us at 800-525-5457 or info@idcfp.com.
John E Rickmeier, CFA
President, jer@idcfp.com
Robin Rickmeier
Marketing Director