Bank Financial History Illustrates a Secular Increase in Profitability
In the last five years, banking financials have improved dramatically based on IDC Financial Publishing‘s (IDC’s) NOPAT ROE rising from 12.0% in the fourth quarter of 2016 to 19.4% in the second quarter of 2021. During the same period, reported stockholders ROE increased from 12.5% to 21.7%. Forecast NOPAT ROE is expected to continue trending upward, increasing to 21.3% by the June quarter of 2022.
What fundamentals are driving this secular improvement in profitability?
IDC’s non-traditional approach to financial ratios, modeling, forecasting, and valuation offers a unique perspective to bank stock selection. The following information demonstrates how we are different and offers an explanation as to why and how the secular improvement is occurring in banking, driving higher price-to-tangible book valuations. By using the following unique ratios developed by IDC to forecast a bank’s appreciation potential, we demonstrate how our approach is superior to the standards of most bank analysis.
The Traditional ROE Equation and the Problem with the Bank Stock Analysis
The traditional ROE equation simply divides net income by the average of common stockholder’s tangible equity capital. The stockholder ROE, as a bottom-line measure of profitability, fails to reflect the true nature of asset value. Additionally, the traditional components of the ROE percentage – net interest margin, net income return on assets (ROA), and resulting stockholder ROE – confuse the source of net income by subtracting cost of funding too early in the analysis. Bank common stock evaluation is unable to separately compare operating and financial returns. Finally, accounting for the loan loss provision with its credit analysis risk deductions (CECL), or addition to net income from releases of reserves, and not adjusting net income for the increase on the loan loss reserve, fails to reflect the true cash flow to earnings used to value a bank stock.
The NOPAT ROE Equation and ROEA, a Measure of Operating Returns
In contrast IDC uses the NOPAT ROE equation to express ROE as a sum of two components, operating return (ROEA) and financial return (ROFL). ROEA equals the return that the bank earns on loans, securities, cash equivalents and other earning assets, after operating expenses and taxes, before the loan loss provision and interest expenses on the deposit and debt funds, but adds back the increase in the loan loss reserve. ROEA focuses on the operating strategy, which identifies returns from investments, loans, and non-interest income sources net of expenses and taxes, plus the cash flow from increases in the loan loss reserve, all as a percent of earning assets. See our example below (Table I) that details the components of NOPAT ROE for all banks analyzed by IDC.
Table I
Bank Financial Ratios Used to Forecast Appreciation Potential
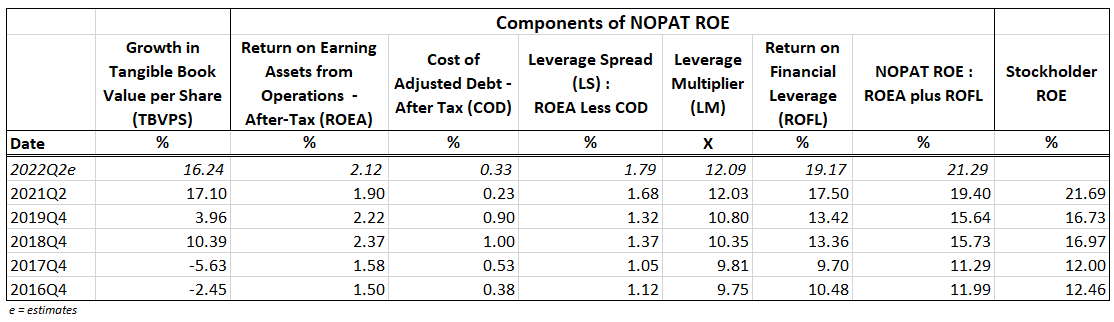
The key components required by IDC to value a bank are growth in tangible book value per share (TBVPS), NOPAT ROE, and cost of equity capital (COE).
Forecast growth in TBVPS is based on recent events of the bank and is driven by higher probability of increasing share buy-backs. The annualized growth in average TBVPS for all 205 banks followed by IDC in the second quarter of 2021 was 17.1% and expected at 16.2% by mid-2022.
The components of NOPAT ROE are the operating returns (ROEA) plus the financial returns (ROFL). ROEA measures the operating profits after tax, excluding the loan loss provisions and funding costs, but includes the increase in the loan loss reserve to capture the true cash flow from operations. In the last five years, ROEA has improved from 1.50% from year-end 2016 to 1.90% in 2021Q2. Banks are expected to return to or exceed the favorable 2.22% earned in the last quarter of 2019, in 2022. IDC forecasts ROEA to recover to 2.12% by the second quarter of 2022 (see Table I).
To compute the financial return (ROFL), IDC forecasts 1) cost of adjusted debt after tax (COD), which are the funding costs divided by the earning assets, excluding tangible equity and the loan loss reserve. COD fell from 0.90% in 2019Q4 and declined to 0.23% in 2021Q2 due to Covid and Federal Reserve policy to keep short term rates near zero. IDC forecasts banks will add 10 basis points to COD by June 2022, increasing after tax cost of debt to 0.33%.
Subtracting COD from ROEA provides 2) leverage spread, which increased from 1.12% at year-end 2016 to 1.68% in 2021, exceeding 1.32% realized in 2019Q4. The forecast for leverage spread improves again in 2022 to 1.79%, as strong operating results exceed the increase in COD.
The most dramatic secular change in banking is 3) the leverage multiplier, which rose from 9.8-times in 2016Q4 to 12.0-times in 2021Q2. The leverage multiplier is the product of the earning assets excluding tangible equity and the loan loss reserve divided by the equity and loan loss reserve.
Return on financial leverage (ROFL) equals the leverage spread times the leverage multiplier. In mid-2022, a record high forecast leverage spread of 1.79% times a record high leverage multiplier of 12.09 provides a record high forecast ROFL of 19.17%. Adding the forecast ROEA of 2.12% to the forecast ROFL of 19.17% provides a forecast NOPAT ROE 21.3%.
What other industry realizes a 77.6% secular increase in ROE in 5 years like banking?
An increase of double-digit growth in TBVPS coupled with a dramatic improvement in ROE to 21.3% creates accelerating EPS growth with a normal terminal p/e of 13.9-times, which offers a 54% appreciation potential for the average bank stock. The estimated target price to forecast TBVPS of 2.95 in mid-2022 is a function of the forecast NOPAT ROE less the cost of equity capital (COE) with the COE based on the forecast of 3% in long term U.S. Bond yields in 2022, plus one-half the bond yield adjusted for the specific risk of a bank. The current price to forecast TBVPS is 2.18.
The terminal p/e ratio of 13.9 is the target price divided by earnings (forecast TBVPS times NOPAT ROE of 21.3%). The same p/e was realized at the end of the last major bull market in early 2018.
Note in Table II, the price to forecast TBVPS in 2017Q4 and 2018Q1 was greater than the target price to forecast TBVPS, indicating fully valued bank stocks. The 5-year, 2-month bank stock bull market from December 2012 to February 2018 realized 124% appreciation in the KBW large bank index and bank stocks were fully valued at the end of that bull market.
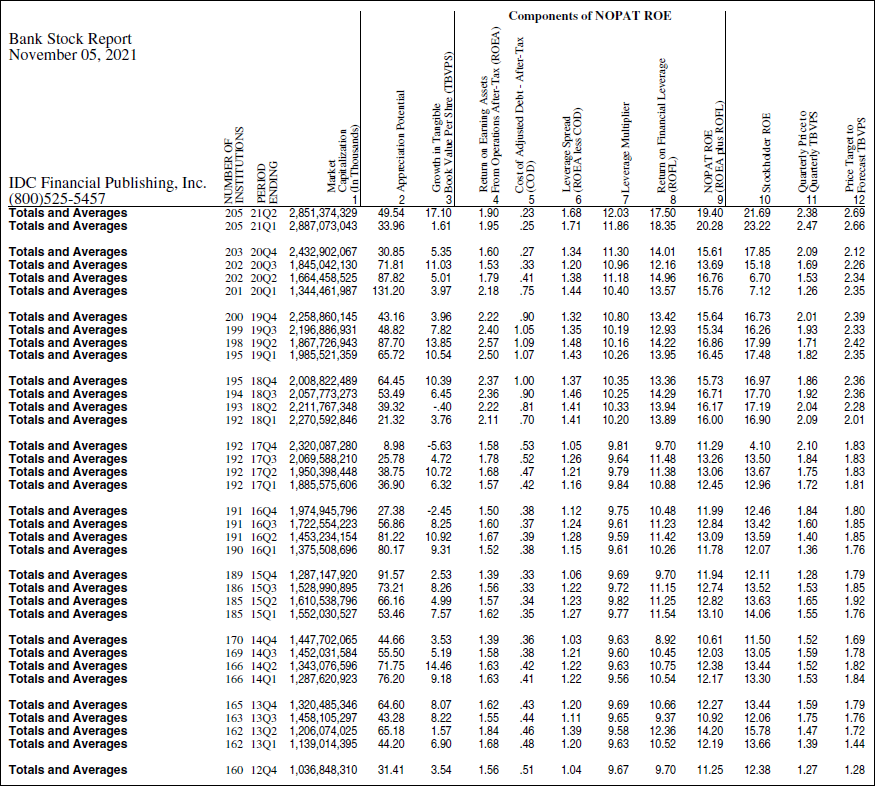
Table II
Bank Financial Ratios from 2012Q4
To inquire about IDC’s valuation products and services, please contact jer@idcfp.com or info@idcfp.com or call 262-844-8357.
John E Rickmeier, CFA
President
Robin Rickmeier
Marketing Director