Yield Spreads Decline Reverses, Offering Substantial Appreciation Potential in Bank Stocks
The flattening of the yield curve, as the U.S. 10-year declines and the 2-year increases, is of great concern to investors today. The fear is that a declining yield curve forecasts a significant economic slowdown, or, if the yield curve narrows to zero, a recession.
In the long bank stock bull market from December 2012 to February 2018, the yield curve peaked at a 250-basis point spread on January 2, 2014 and declined to a 50-basis point spread by January 4, 2018. Yet, bank stocks represented by the KBW Large Bank Stock Index (BKX) rose 130.5%, outperforming the S&P 500, which increased 92.5% over the same 5-year and 2-month period (see chart below).
The yield curve dramatic decline from the beginning of 2014 to July 8, 2016, from 260 to 75 basis points, suddenly reversed in July 2016 and rose to 136 basis points through year-end 2016. Bank stocks rose 44% compared to the S&P 500 increase of 6.4% from July 8, 2016 to December 23, 2016.
The 10-year less 2-year yield spread today at 76 basis points is near the level of June 2016, after declining from a peak of 158 basis points in March 2021.
This year’s collapse of the yield curve was due to Covid-related fear and uncertainty around an economic slowdown and inflation. Together, this led to massive short covering of the 10-year (resulting in lower 10-year yields) as 2-year yields rose, in anticipation of the Federal Reserve’s future tightening, raising the Fed funds rate in 2022 and 2023.
The negatives causing the decline in the yield curve are seemingly priced in today with a widening of spreads forecast in the first half of 2022, similar to that of the last half of 2016. A widening of the yield curve between the 10 versus 2-year yields from 76 to over 130 basis points in the next six months forecasts a major increase in the price of bank stocks in 2022, substantially outperforming the S&P 500 and the average value stock.
After the peak in yield spreads to 136 at the end of 2016 and subsequent decline to 50 in February 2018, bank stocks continued to increase. The BKX rose from 93 to 116, for a 25% appreciation. Therefore in 2022 and 2023, after a peak in yield spreads in mid-2022, bank stocks are expected to continue to outperform (see chart below).
Chart I
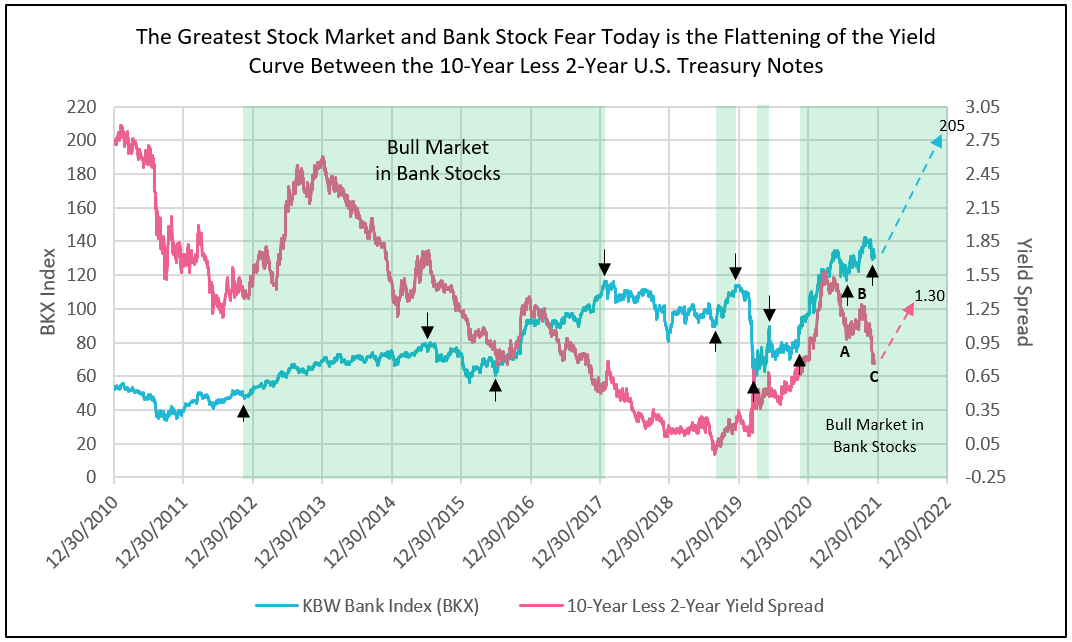
The chart pattern above on the 10-year less 2-year yield spread illustrates the correction (points A, B and C from June 5 to today) of the widening of the yield spreads that occurred from year-end 2019 to June 5, 2020. The C leg of the correction has reached exhaustion, setting up the forecast for a rebound to 1.3% by June 2022.
To inquire about IDC’s valuation products and services, please contact jer@idcfp.com or info@idcfp.com or call 262-844-8357.
John E Rickmeier, CFA
President
Robin Rickmeier
Marketing Director