Copper to Gold Ratio Forecasts 2.0% to 2.5% U.S. 10-Year Yields and a Strong Bull Market in Bank Stocks
In order to understand the forecast of the copper to gold ratio, it is key to examine the components. Copper is the bellwether of the strength of the economy.
The price of copper peaked in mid-2018 at $3.42 and fell to a Covid-driven low of $2.15 at the end of March 2020. In the first leg of economic recovery from March 2020 to May 2021, the price of copper rose from $2.15 to a peak of $4.83. From May to September, copper was in a period of consolidation with the rise in Covid-19, and its economic impact caused copper prices to decline from $4.83 to $3.97 on September 29. Copper again recovered to $4.78 in October, only to be met by further breakouts of the Delta and Omicron variants of Covid, resulting in copper prices ending 2021 at $4.37.
Copper is basic to the economy, as it is used in cars and trucks, to housing and appliances, to electronics, all of which require significant amounts of copper in order to function. But supply chain crunches continue as economies worldwide try to recover, then face renewed challenges with the ongoing pandemic and Covid variants. The housing problems in China further dampened international demand. In 2022, as supply chain problems are solved, automobile production recovers, and housing remains strong, copper prices rise from the consolidation period with prices ranging from $4.20 to $4.80 to a forecast price of $5.50 by year-end 2022.
Gold, on the other hand, is an inflation expectation gauge. Since the beginning of 2021, gold peaked at $1,950, followed by a cycle peak of $1,915 on June 1, and another peak at $1,882 in mid-November. The cycle lows rose from March to December, forming a triangle, which forecasts a breakout to the downside. The “A” forecast (shown in Chart I) is to $1,680, the old low on March 29, 2021, while “B” forecasts a decline to $1,571 as inflation proves to be transitory (see Chart I).
Chart I
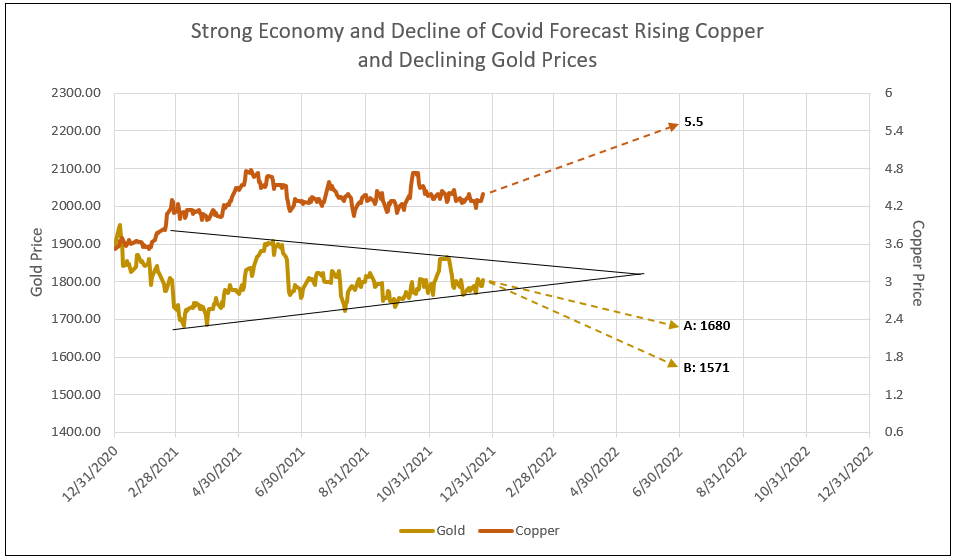
Please note during the increase in copper prices from the beginning of 2021 to May, gold price declined from $1,950 at the beginning of the year to $1,680 at the end of March. Therefore, it is reasonable to expect gold prices to decline in 2022 as copper prices rise to new highs (see Chart I).
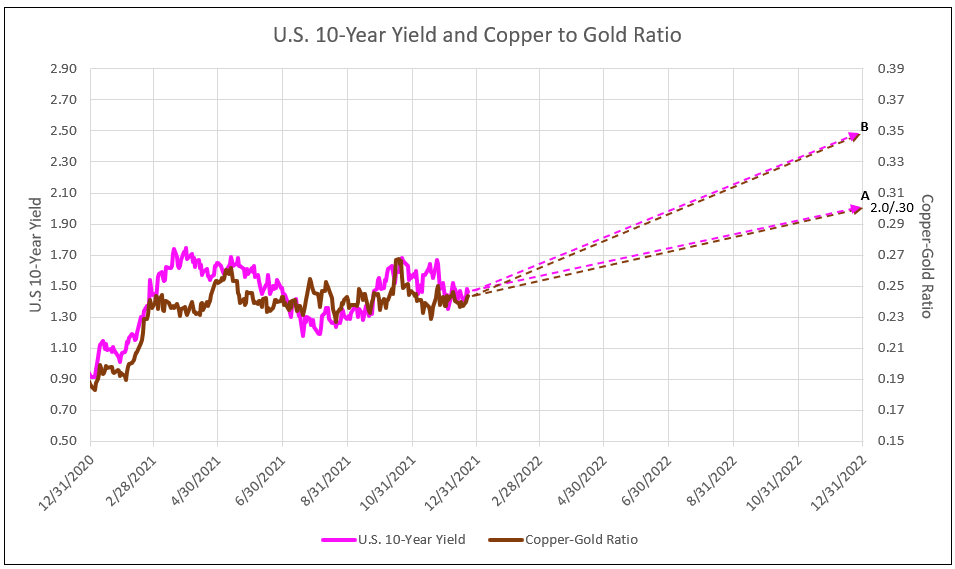
Translating the forecasts of copper and gold prices to a forecast of the ratio of copper to gold/1000 provides A) 0.30 or B) 0.35. These projections in turn forecast the U.S. 10-year yield to increase to A) 2.0% or B) 2.5% by year-end 2022 (see Chart II and III). Note in Chart III, the correlation of daily plots is high in 2021, allowing one to track the path for the A or B forecast.
Risk to the Forecast
Continued Covid fear and supply chain problems could maintain the copper price in the $4.20 to $4.80 rang with gold flat at $1,800, resulting in a copper to gold ratio range between 0.25 and 0.27 for 2022. Under the forecast, the 10-year yield would vary between 1.3% and 1.7% (see Chart III).
Chart II
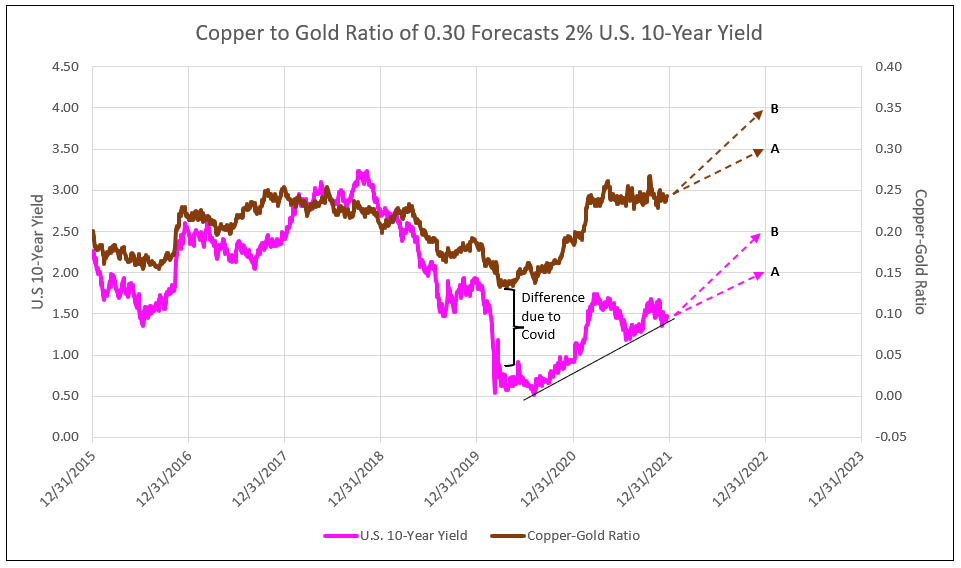
Chart III
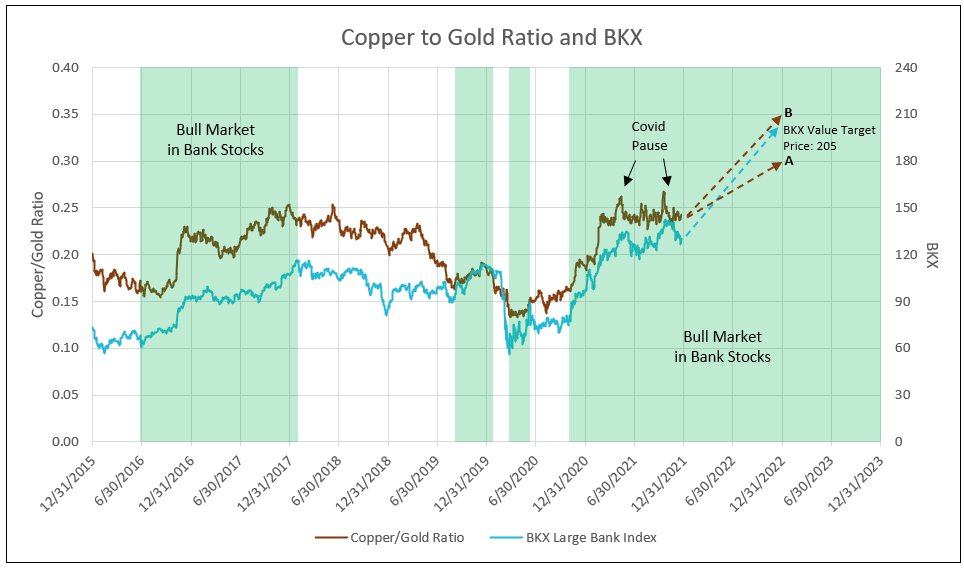
Bank Stocks Forecast by the Copper to Gold Ratio
The bull market in bank stocks beginning in June 2016 to February 2018 was supported by a rising ratio of copper to gold, as the 10-year yield increased. This ratio confirmed the bank stock bull markets of August 2019 to early 2020, the Covid low in the end of March 2020 to June 6, and the current bull market beginning in October 2020.
The recent pause in the rise in the copper to gold ratio from May 2021 to date, as a result of recurrences of Covid, was reflected in flat bank stock prices in the same period. The IDCFP price target for the KBW Large Bank Stock Index (BKX) of 205, forecasting 57% appreciation potential, falls between the A and B projections of the copper to gold ratio by year-end 2022 (see Chart IV).
Chart IV
To view all our products and services please visit our website www.idcfp.com.
For more information about our ranks, or for a copy of this article, please contact us at 800-525-5457 or info@idcfp.com.
John E Rickmeier, CFA
President
jer@idcfp.com
Robin Rickmeier
Marketing Director