How Banks Benefit from Increases in the Federal Funds Rate
The Federal Reserve is expected to raise the Fed funds rate in March for the first time in more than three years and shrink their balance sheet soon after, as indicated by Bloomberg in a survey of 45 economists. While the vast majority forecast a 25-basis point hike, two indicated a 50-basis point increase. The economists were split between expecting the Fed to hike three or four times in 2022, in view of a stronger economy post-omicron and labor market accompanied by the highest inflation in almost four decades.
Table I

In order to understand the impact of a higher Fed funds rate on the banking system, IDC Financial Publishing (IDCFP) compares to the funds rate:
- The after-tax cost of debt, which is the interest cost divided by earning assets not funded by tangible common equity and the loan loss reserve (see Chart I and Table II) and
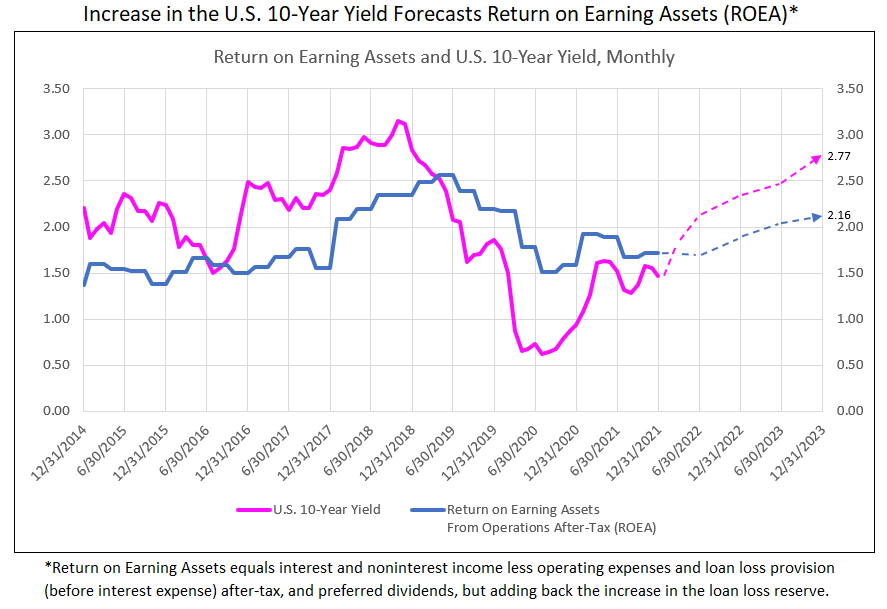
- The operating return on earning assets, defined as interest and non-interest income less provision for loan loss and operating expenses, all net of taxes, and after preferred dividends, but adding back any increase in the loan loss reserve (see Chart II and Table II).
The financial impact of a steady rise in the Fed funds rate of 230-basis points from 12/31/2015 to 3/31/2018 was an increase in the cost of debt from 33-basis points in 2015 to 107 in 2018Q1: a 74-basis point increase. The banks after-tax cost was 32% of the 230-basis point hike. The forecast of 150 basis point increase in the Fed funds rate in Table I is expected to raise the bank cost of debt 48 basis points from 21 today to 69 by the end of 2023 (see Table II).
Return on earning assets (after-tax), on the other hand, responds to the U.S. 10-year yield, The 10-year yield anticipates both the strength of the economy and Fed actions of both raising the funds rate and reducing the balance sheet. The yield recently peaked at 1.87% and is expected to reach 2.1% by June 2022, 2.4% by year-end, and 2.77% by the end of 2023. ROEA, the after-tax operating return, excluding funding costs, is forecast to rise from 1.68%, at year-end 2021, to 1.92% by year-end 2022, and 2.16% by the end of 2023 (see Chart II and Table II).
Leverage spread, the difference between ROEA and COD, was 1.47% at year-end 2021 and expected to widen to 1.51% by December 2022. A similar widening occurred from the end 2015 to early 2018, the last time there was a sustained rise in the Fed funds rate and significant increase in the 10-year yield. Leverage multiplier is the level of earning assets not funded by tangible common equity and the loan loss reserve divided by the equity and reserves. The leverage multiplier ended 2021 at 12.2-times (see Table II).
As the economy continues strong and loan growth accelerates, the leverage multiplier is expected to increase to 12.8-times by the end of 2022 and will remain at that level in 2023. The leverage spread times the leverage multiplier provides the return of financial leverage, ROFL, which is forecast to increase from 17.93% at year-end 2021 to a peak of 19.32% by December 2022 (see Table II).
Finally, profitability, or NOPAT ROE, which equals the after-tax operating return (ROEA) plus the financial return (ROFL) is forecast to increase from 21.24% at year-end 2021 and remain at 21% by March 2023. The high and rising ROE produces substantial reinvestment in TBVPS, and combined with stock buybacks, drives superior growth in TBVPS, the foundation of bank stock valuation.
Despite the fear of a rising Fed funds rate and higher 10-year yields that are reflected in the volatile stock market, bank stocks benefit from both, as illustrated above in widening operating and financial returns, and, therefore, ROE. Like the 2016 to early 2018 bull market in bank stocks, the years 2022 and 2023 offer an opportunity of another leg in the bank stock bull market, on top of the already dramatic rise in bank stocks from October 2020 to January 2022.
Table II
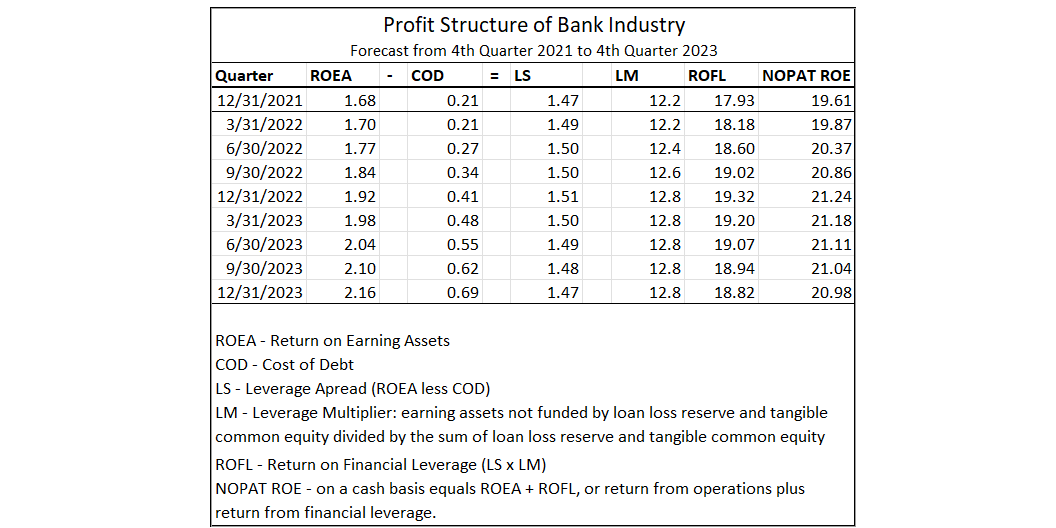
Chart I
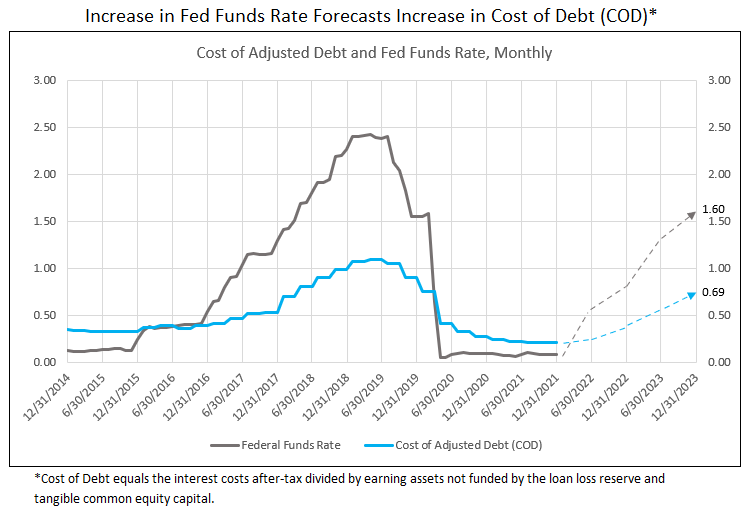
Chart II
Let IDC provide you the value and financial history of your favorite bank stock. For you to better understand our process of valuation, we offer a free, one-time analysis of one of the 202 banks in our bank analysis database. Simply send your request with the bank stock symbol to info@idcfp.com.
To view all our products and services please visit our website www.idcfp.com. For more information, or for a copy of this article, please contact us at 800-525-5457 or info@idcfp.com.
John E Rickmeier, CFA
President
jer@idcfp.com
Robin Rickmeier
Marketing Director