The Objective of Bank Stock Portfolio Selection is to Outperform Bank Exchange Traded Funds
Bank stocks are represented by different ETFs. The large money center and regional banks, KBWB, (up 1.42% in the last month), regional banks, KRE, (down 0.08%), S&P financials, XLF, (down 1.33%), S&P large banks, KBE, (down 0.37%), or community banks QABA (down 1.29%).
IDC Financial Publishing (IDCFP) ranks bank stocks’ potential performance by price momentum, value (appreciation potential) and a new rank of EPS growth. The ranking method creates levels for each of the three drivers of performance, from 5 (the highest) to 1 (the lowest). The 20 banks with a combined rank of 12 or more out of 15 outperformed all the bank ETFs sited above, with an average appreciation of 6.6% over the last month.
Determining Appreciation Potential of a Bank Stock
IDCFP forecasts each bank stock by component of its operating and financial returns to determine the NOPAT ROE or cash earnings return on tangible common equity per share. The operating return (ROEA) is income less operating expenses and loan loss provisions (excluding funding costs), all after-tax and preferred dividends, but adding back any increases in the loan loss reserve. The ROEA captures the true operating after-tax cash return from earning assets.
Financial return (ROFL) measures the leverage spread (operating returns [ROEA] less the cost of funding debt) times the leverage multiplier (the earning assets greater than tangible common equity and the loan loss reserve divided by the tangible equity and the loan loss reserve). The cost of funding debt (COD) equals the interest cost (after-tax) divided by earning assets greater than, or not financed by, tangible common equity and the loan loss reserve.
The addition of the operating return (ROEA) plus the financial return (ROFL) equals the net operating profit (after-tax) on equity, or NOPAT ROE.
IDCFP subtracts from the NOPAT ROE the cost of bank equity capital (COE) to determine value. The COE equals the forecast long-term U.S. bond yield (3%) plus one-half of that yield times the specific risk factors of a bank for normal COE forecast between 5% and 7% and as high as 11%.
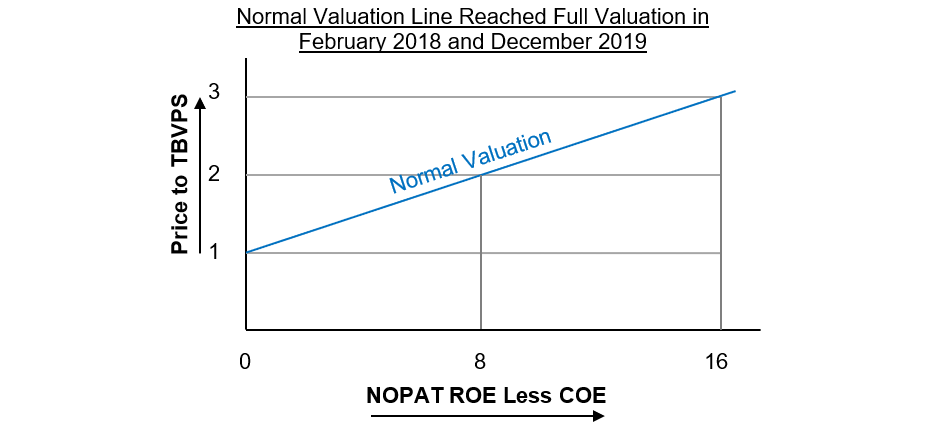
The value-added for a bank is the NOPAT ROE less COE (as an example, 14% less 6% equals 8%) determines the price-to-forecast tangible book value per share (TBVPS). Given a ROE less COE of 8% forecast 2-times forecast TBVPS and the bank sells at 1 ½ times forecast TBVPS, the appreciation potential is 33%. For individual bank stocks, a forecast of price to TBVPS varies with the level of forecast ROE less COE (see Chart I).
IDCFP ranks appreciation potential for 204 bank stocks in levels from 5 to 1 (see Proof of Valuation Methodology section at the end of this article).
Calculating the Rank of Price Momentum
The rank of price momentum measures the bank stock price momentum by the following metrics: 1) the current price is above the 20-day moving average, 2) the current price is above the 50-day moving average, 3) the last 20-day price change is greater than the average 20-day price change over the last 100 trading days, 4) the 1-month price change is greater than the S&P 500 price change and 5) the 1-month price change exceeds the 1-month price change in the KBW Large Bank Index (BKX).
A bank stock exceeding each of these 5 momentum gauges is ranked 5 in price momentum. Exceeding 4 receives a price momentum rank of 4, and so on, down to a rank of 1. Failure to meet any of the momentum criteria results in a rank of zero.
Rank of EPS Growth
The rank of EPS growth consists of the percentile rank from the last 12 months of growth in quarterly IDCFP’s cash earnings per share, which is then averaged with the percentile rank of the growth from the last reported EPS to the quarterly forecast of EPS four quarters ahead (forecast of TBVPS times forecast NOPAT ROE). The average of the two percentiles are decline ranked between 5, the highest, and 1, the lowest, providing the combination of past reported performance and future growth expectations.
The Combined Ranks of Price Momentum, Value and Growth Determine the Banks that Outperform in Price Appreciation
Over the past month the 20 banks with combined ranks of 12 or higher rose 6.6% and outperformed all bank ETFs. Similar results occurred with a 28.8% appreciation following the bank stock buy on July 19, 2021, and a 11.4% appreciation following the buy add on December 1, 2021.
In a stock market correction, the number of bank stocks with a combined rank greater than 12 declined to 20 after reaching a peak of 53 out of 204 banks analyzed. In Table I, the 15 large cap and 15 small cap stocks, held by Mr. Rickmeier, President of IDCFP, in a portfolio, illustrated similar outperformance in both the bank bull market since July 2021 and from the recent buy add on December 1, 2021.
Table I
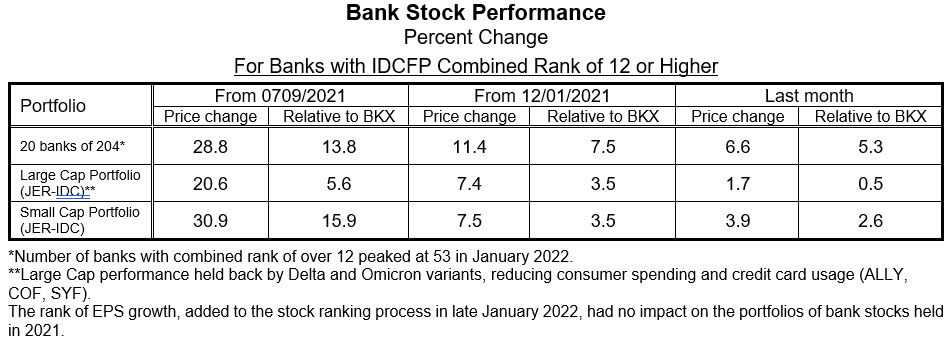
For a portfolio manager, or individual with a stock portfolio, bank stocks should today be over-weighted given the prospect of rising yields. The bank stocks held in a portfolio with a rank above 12 offer the best appreciation potential, above the respective ETF alternative or the stock market average.
Proof of Valuation Methodology
Chart I
The history of bank stock valuation, provided by appreciation potential of bank stocks from 2012 to 2021 demonstrates its accuracy. The major bull market in bank stocks began on December 12, 2012, and lasted to February 15, 2018, with the KBW Large Bank Index appreciating 130.5% over that 5-year, 2-month period, or 17.4% a year.
For the average bank stock, numbering 159 in 2012 to 190 in 2018, the average capitalization weighted 12-month appreciation potential, based on IDCFP’s valuation, began at 33.3%, rose to a peak of 95.52% in 2015, and ended in 2017Q4 with only a 11.1% appreciation potential, an indication of full valuation. A second valuation measure, current price to forecast TBVPS versus forecast price to forecast TBVPS (columns 11 & 12 in Table IV), provided a favorable spread from 2012 to 2017, but by year-end 2017 current price to TBVPS exceeded forecast price to TBVPS, indicating full valuation.
The current bank stock bull market began on October 29, 2020, with a 75% appreciation potential for the average bank stock. Despite an 68.8% appreciation in the KBW Large Bank Index from October 29, 2020, to January 28, 2022, another 53.8% appreciation potential in the BKX is forecast over the next 12 months. The current bull market could well offer the same or greater opportunity seen in the last bank stock bull market from 2012 to 2018.
Accuracy of Valuation Line in History
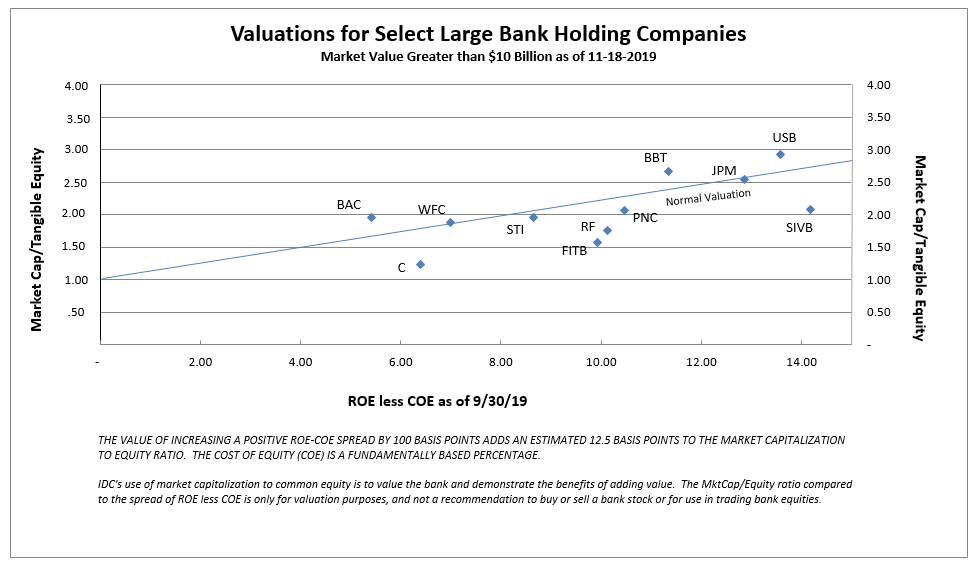
The following charts published by IDCFP in late 2017 (Chart II) and late 2019 (Chart III) highlight valuation data from the previous quarters, during periods of peaks in bank bull markets. Market capitalization to equity represented the price to tangible book value. The valuation line in history demonstrates the accuracy of this method.
Chart II
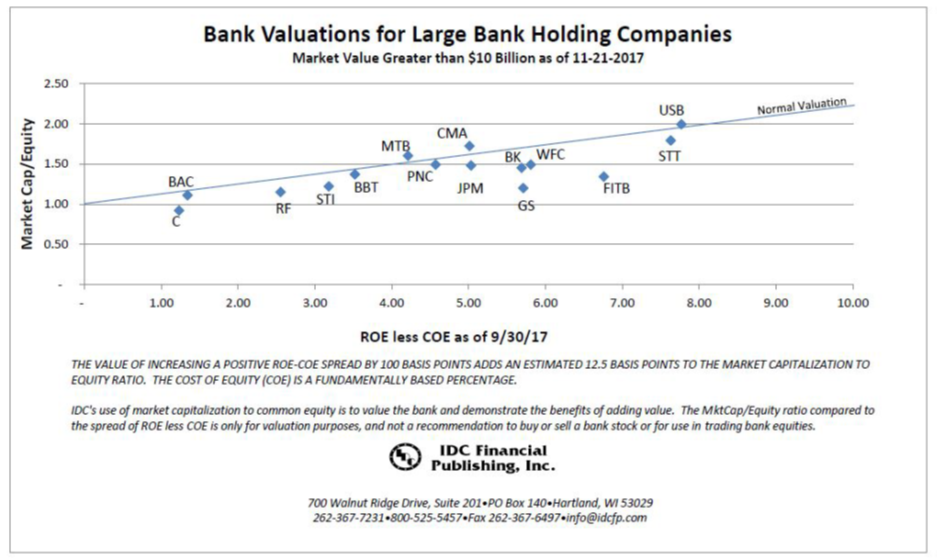
Chart III
Let IDC provide you the value and financial history of your favorite bank stock. For you to better understand our process of valuation, we offer a free, one-time analysis of one of the 202 banks in our bank analysis database. Simply send your request with the bank stock symbol to info@idcfp.com.
To view all our products and services please visit our website www.idcfp.com. For more information, or for a copy of this article, please contact us at 800-525-5457 or info@idcfp.com.
John E Rickmeier, CFA
President
jer@idcfp.com
Robin Rickmeier
Marketing Director