Confirmation of IDCFP’s Forecast of Zero for the 10-Year TIPS Yield
Value Stocks Outperforming Growth Stocks
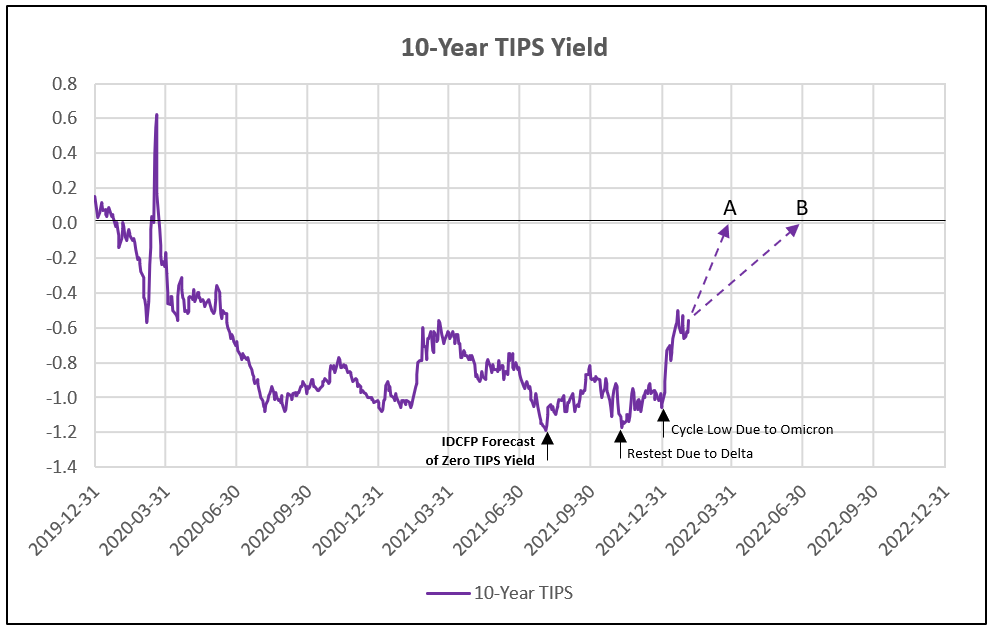
In July 2021, IDC Financial Publishing (IDCFP) forecasted the TIPS yield would recover to pre-pandemic levels with the decline in Covid in early 2022. This forecast of the real 10-year yield rising to zero in 2022 was confirmed by Morgan Stanley’s cross-asset strategist. On January 28, 2022, the strategist escalated his projection, stating inflation-adjusted yields will rise from deeply negative levels back to the pre-pandemic norm, further supporting IDCFP’s projection from last year.
Last week the German 10-year yield rose to positive levels for the first time since early 2019. High inflation and economic recovery in Europe lifted the yield to a positive 0.20%, with the prospect of increasing to 0.70% in 2022. The spread of the German 10-year to U.S. TIPS is about 70 basis points, therefore the strong recovery in the German yield to 0.70% will lift the U.S. 10-year TIPs to zero.
As shown in Chart I, the recovery to zero in the 10-year TIPS is forecast by year-end, or as soon as in March (A) or in June (B). This recovery, combined with 2.4% implied inflation, projects a 2.4% nominal 10-year yield.
Chart I
Value Stocks Outperform Growth Stocks
Morgan Stanley indicated “a move toward positive territory in the TIPS yield raises the pain threshold for expensive tech stocks that dominate the U.S. stock market…These stocks tend to be especially sensitive to rising rates that mean their future profits are worth less” 1 (i.e., profits or cash flows discounted at a higher rate).
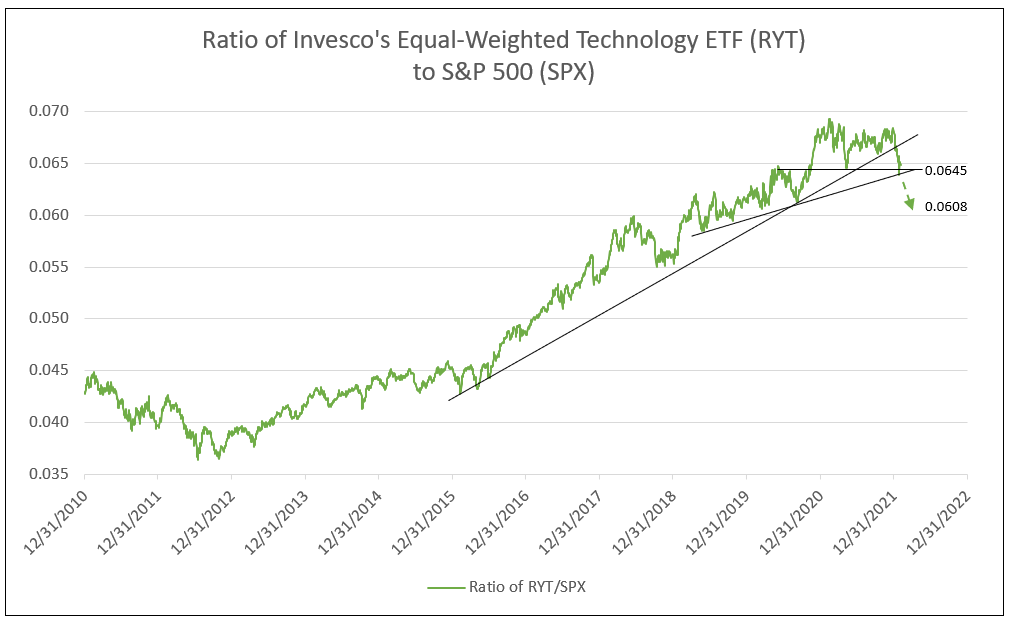
While the long-term trend from 2016 in the ratio of equal-weighted technology to the S&P 500 was broken, the shorter-term trend from 2019 remains intact (see Chart II). A decline below the 2019-to-date trend would occur if the TIPS 10-year increases to zero, implied inflation remains 2.4% and the nominal 10-year yield increases to 2.4%. Use of the equal-weight technology index focuses on the broad category of tech, not simply the FAANG stocks.
However, the recent decline below the horizontal line at 0.0645, the lows of the double top formation, implies the ratio of Invesco’s Equal-Weighted Tech ETF to the S&P 500 would fall to 0.0608 (see Chart II).
Chart II
Goldman Sachs Group strategist David Kostin warned that a rise in the 10-year TIPS from a negative 60 basis points to zero implies major risk to the continued correction in growth stocks, especially FAANG stocks.
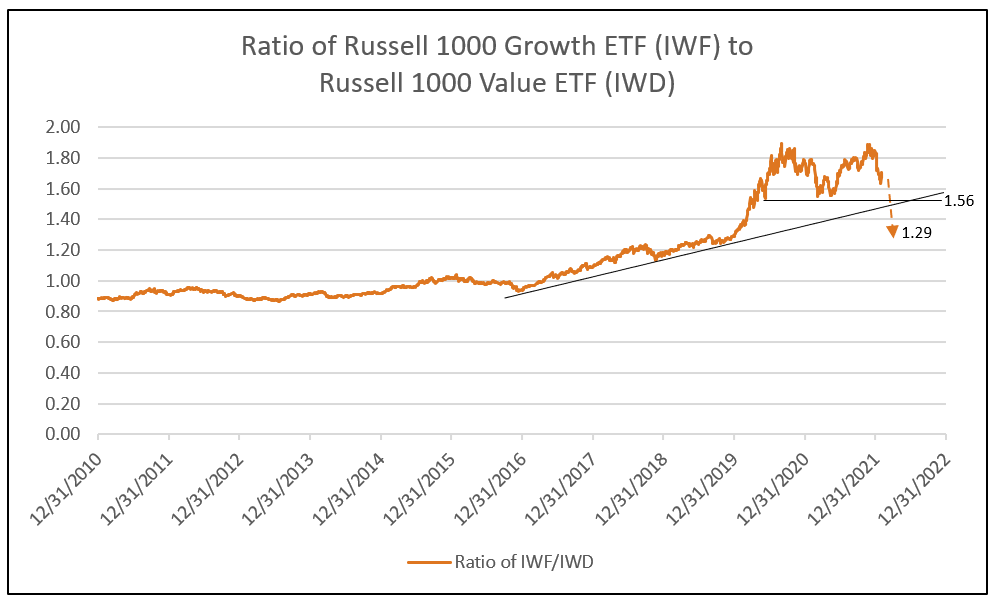
Large cap ratio of growth to value remains above the trend line from 2016 and above the base of the double top formation (base at 1.56). Currently at 1.66, a drop in the large cap ratio below 1.56 would indicate severe risk to growth stocks. A potential decline in the ratio from 1.66 to 1.29, or 17.5%, indicates underperformance of large cap growth and tech stocks compared to value stocks in the first half of 2022 (see Chart III).
Chart III
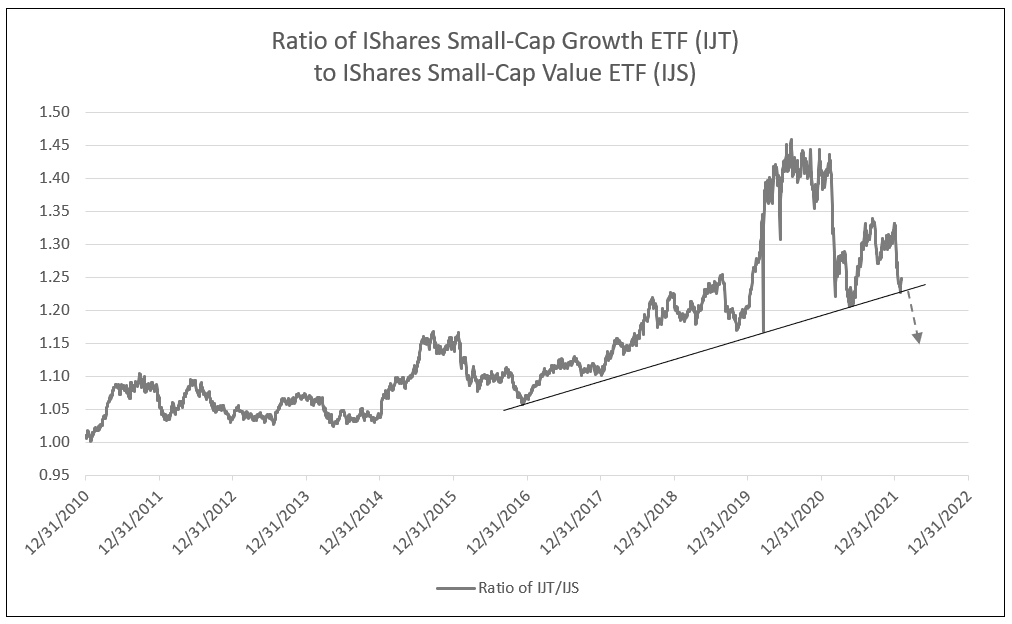
Small cap ratio of growth to value is at the trend line from 2016. A decline in large cap tech stocks relative to value (Chart III) would create a breach to the downside in the trend of small cap growth to value, falling to the forecast 1.15 level. Together, this would indicate a substantial outperformance of value (bank stocks) versus growth equities (see Charts III and IV).
Chart IV
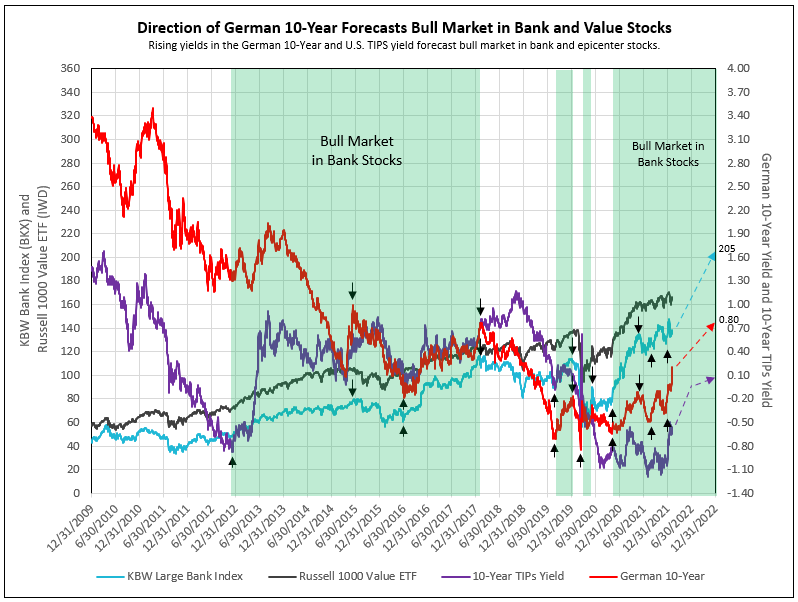
Bank Stocks Outperform Russell 1000 Value Stocks
Morgan Stanley has been bearish on U.S. growth stocks and bullish on U.S. value stocks tied to the economic expansion in 2022, like bank stocks. See the performance of banks relative to the Russell 1000 value stocks in the bank stock bull market since October 2020.
KBW Large Bank Index rose from 77 at the end of October 2020 to 137 on February 3, 2022, for a gain of 78%. For comparison, the Russell 1000 Value ETF increased 42% over the same period. Appreciation potential for the KBW Large Bank Index over the next year is another 49.6% from 137 to 205 (see Chart V).
Chart V
1 - Morgan Stanley's Sheets See More Pain Ahead for U.S. Stocks
Let IDC provide you the value and financial history of your favorite bank stock. For you to better understand our process of valuation, we offer a free, one-time analysis of one of the 202 banks in our bank analysis database. Simply send your request with the bank stock symbol to info@idcfp.com.
To view all our products and services please visit our website www.idcfp.com. For more information, or for a copy of this article, please contact us at 800-525-5457 or info@idcfp.com.
John E Rickmeier, CFA
President
jer@idcfp.com
Robin Rickmeier
Marketing Director