Value and Especially Bank Stocks Outperform Growth and FANG+ Stocks Through 2022
The Link Between Bonds and Stocks
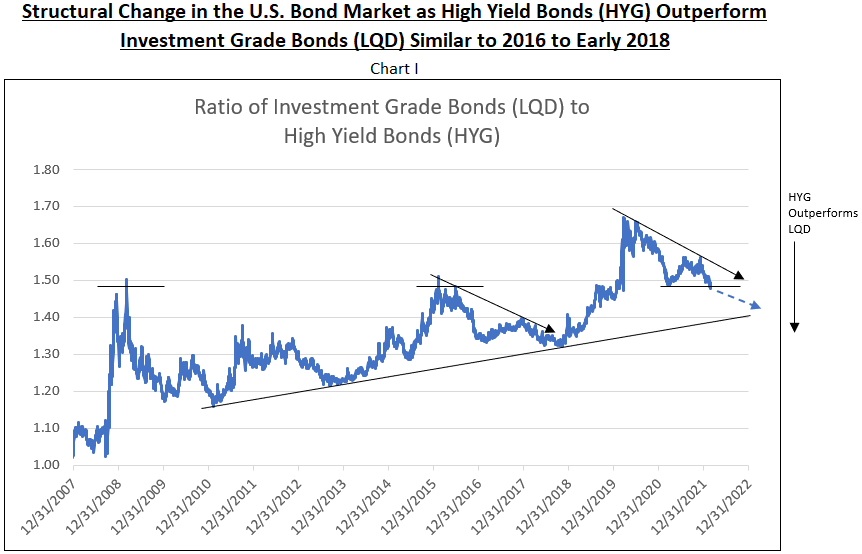
The link between the bond and stock markets is the performance of high yield compared to investment grade bonds. (High yield bonds are a proxy for epicenter or value stocks.) The flight to safety due to the advent of COVID resulted in the High Yield Corporate Bond ETF (HYG) underperforming the Investment Grade Corporate Bond ETF (LQD) in March 2020. In the subsequent period from March to October 2020, the price of LQD rose dramatically with a double top in August and October of 2020, outperforming HYG. Since then, from October 2020 to date, the price of LQD has drifted lower, and after mid-December 2021, accelerated to the downside, more than the decline of HYG.
The ratio of Investment Grade (LQD) to High Yield (HYG) peaked in March 2020 and declined modestly to a cycle low in August 2020. The two periods of a rising ratio in 2021 were due to the emergence of the Delta and Omicron COVID variants. In the second half of 2021, the ratio of LQD to HYG again declined and has accelerated to the downside from December 2021 to date, breaking support at 1.49 (see Chart I). The bond market again favored high yield over investment grade as bonds were priced for the end of COVID as a major illness.
Value Stocks Outperform
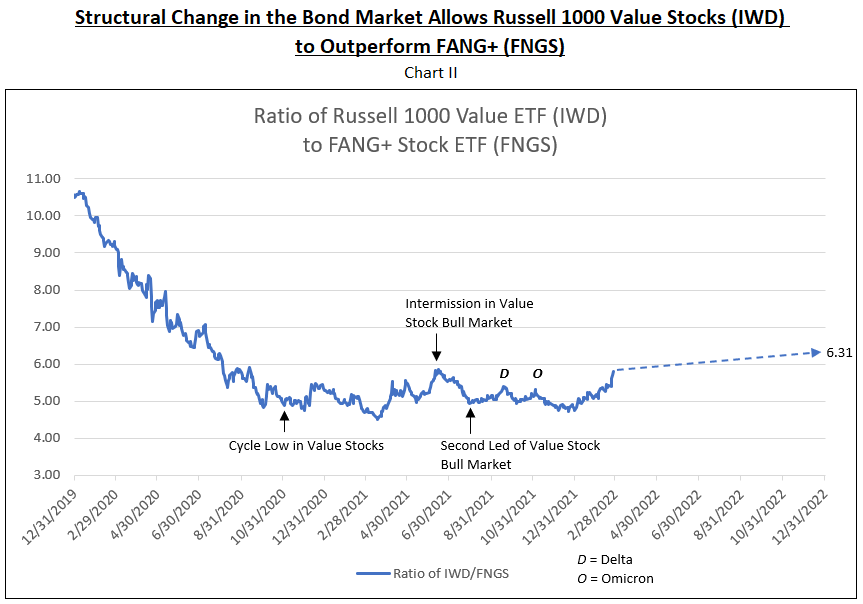
Since October 2020, value stocks outperformed growth, or FANG+ stocks, for these short periods: October 2020 to year-end 2020, March to May 2021 and December 2021 to date. The cycle in the Russell 1000 Value Stock ETF (IWD) compared to FANG+ Stock ETN (FNGS) moved sideways from October 2020 to date. Over the remainder of 2022, the IWD Value ETF is expected to appreciate more than the FANG+ ETN is forecast to increase, taking the ratio to 6.31-times, or a new cycle high in the ratio (see Chart II).
Bank Stocks Outperform FANG+
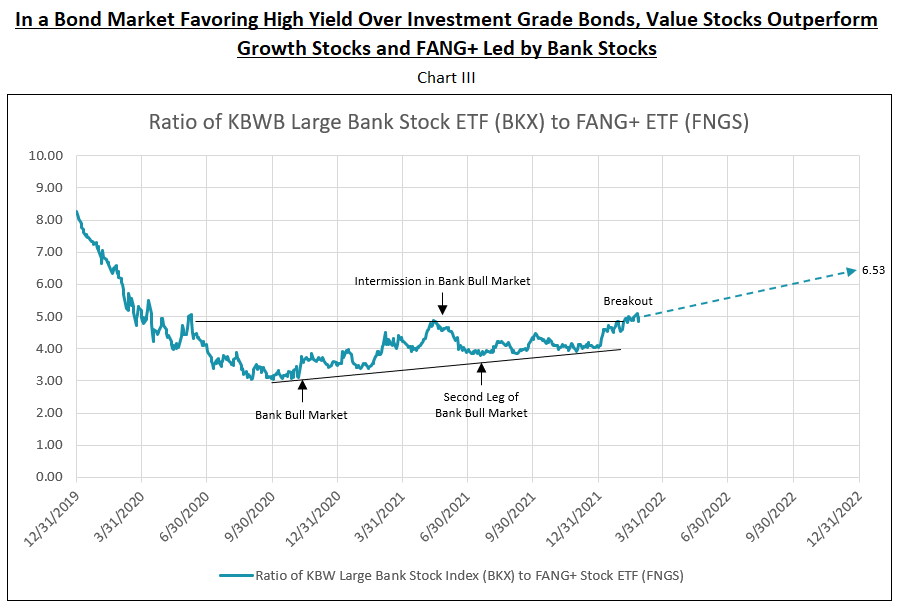
The bank stock bull market began in October 2020, and the first leg ended in May 2021, during which period bank stocks outperformed FANG+. The intermission between the first and second legs of the bull market occurred from May to July 2021. The second leg of this bull market began in July 2021, was interrupted in August, and again in September, by COVID variants, but recovered again in December 2021 and continues to reach new highs.
Price appreciation for the average of 202 banks analyzed by IDCFP was 18.9%, calculated from the inception date of the second leg of the bank bull market on July 19, 2021 to February 25, 2022. The price appreciation from the buy-add on December 1, 2021 to February 25, 2022 was 6.4%. Both exceeded the increases in KBW NASDAQ Bank Index (BKX).
Appreciation potential to year-end 2022 of the KBW NASDAQ Bank Stock Index (BKX) is forecast at 50%. The ratio of BKX to FNGS broke out of its range and is projected to increase steadily for the rest of 2022 (see Chart III).
Small Cap Growth Declines Relative to Small Cap Value, Confirming the Outperformance of Value Versus Growth and FANG+
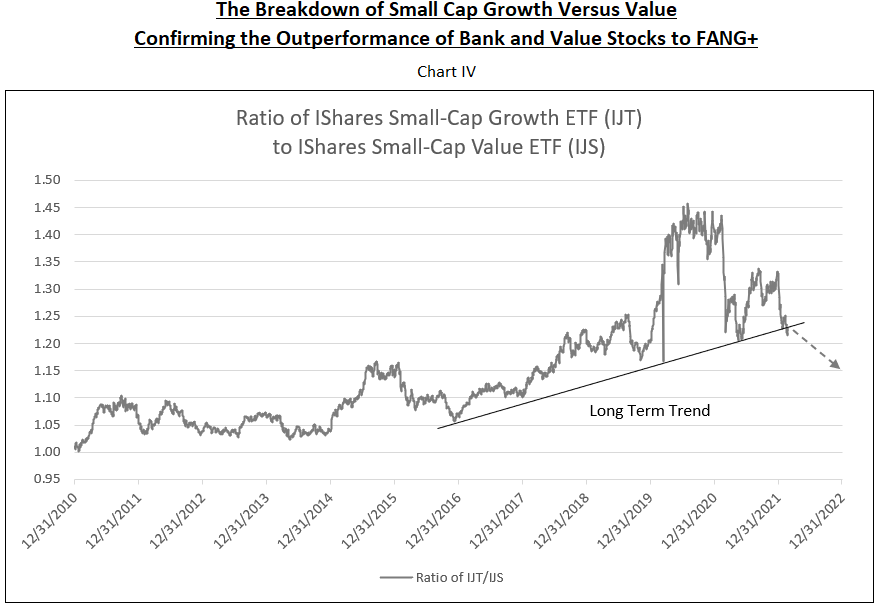
The rising long-term trend of small cap growth outperforming value has been in place since 2016. The significant increase in the ratio of growth to value in 2020 occurred due to the overvaluation of stay-at-home stocks in the initial COVID period that year. The major decline in the ratio of Small-Cap Growth ETF (IJT) to Small-Cap Value ETF (IJS) occurred from October 2020 to May 2021 -- the first leg of the bank stock bull market. The emergence of COVID variants Delta and Omicron allowed for outperformance of growth to value stocks from May until late 2021. The sharp decline in growth relative to value from late 2021 to date and the breaking down of the long-term trend in February 2022, together, support the conclusion that value stocks, in particular bank stocks, will outperform growth in 2022 (see Chart IV).
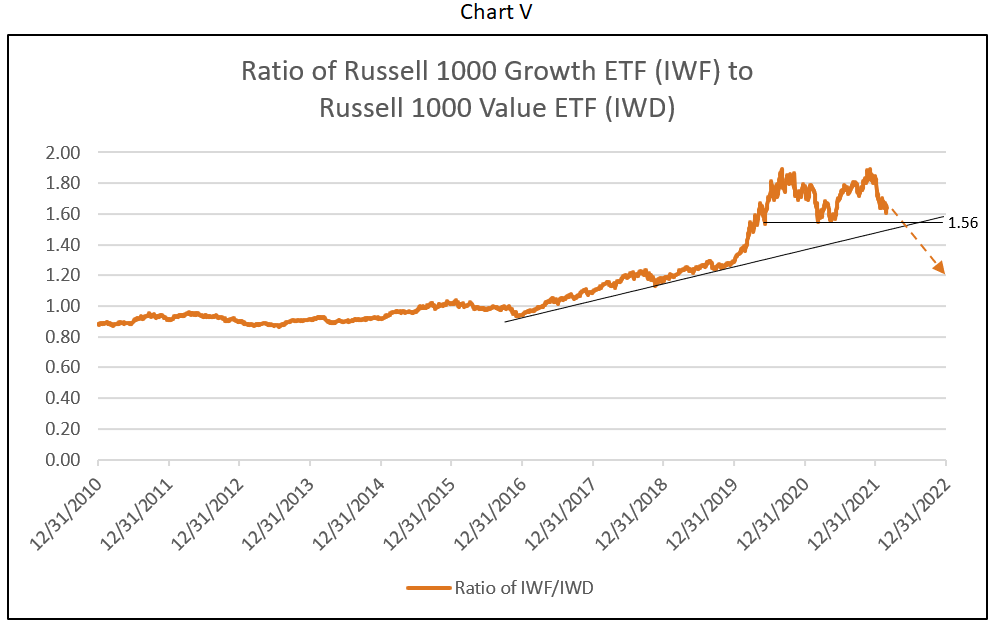
Rotation of Growth to Value
To further illustrate the large stock rotation from growth to value, Chart V shows the ratio of the Russell 1000 Growth Stock ETF (IWF) to the Russell 1000 Value Stock ETF (IWD). Note the double top in the ratio in 2020 and late 2021. The ratio reached a cycle low of 1.56 on May 13, 2021. Currently at 1.64, a decline below 1.56 forecasts major risk to growth versus value.
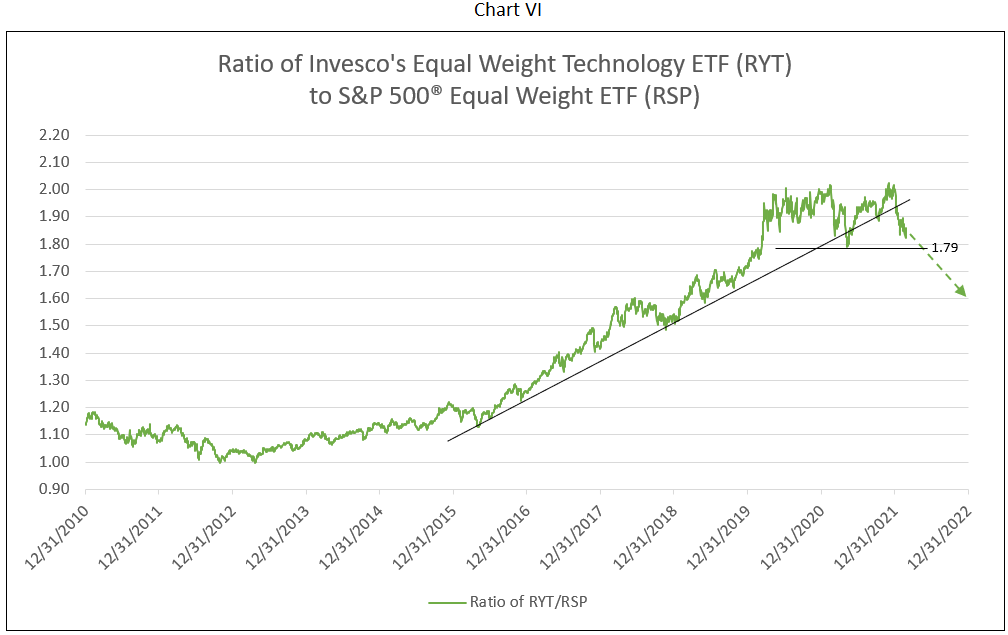
Another measure of this rotation is the unweighted averages of technology ETF (RYT) compared to the unweighted S&P 500 ETF (RSP). This ratio also experienced a double top, breaking the long-term trend from 2016 in 2021 with a low of 1.79. Currently at 1.84, a drop below 1.79 forecasts continued rotation with underperformance of growth versus value.
All of the breakdowns of growth to value illustrated in the above charts were well preceded by the fall of high grade bonds (LQD) to high yield bonds (HYG). Beginning in early February 2022 this ratio broke below support at 1.49 and is currently at 1.48 as of February 25, 2022 (see Chart I).
To view all our products and services please visit our website www.idcfp.com. For more information about our ranks, or for a copy of this article, please contact us at 800-525-5457 or info@idcfp.com.
John E Rickmeier, CFA
President
jer@idcfp.com
Robin Rickmeier
Marketing Director