Inflation Peaks by Mid-Year 2022
Summary of Inflation
The rapid pickup in inflation boils down in large part to the mismatch between supply and demand. With the help of a massive government stimulus, a surge in household purchases strained factories and lengthened global supply chains. Current constraints of U.S. producers trying to ramp up production were made worse by a smaller pool of available labor. The tight labor market, in which the unemployment rate is now under 4% (with relatively low participation rates of 62.3% - below the rate in 2019 at 63.3%), has led employers to bid up wages in an attempt to fill millions of job openings and retain workers. In addition, the Russian invasion of Ukraine and subsequent sanctions and trade restrictions further stimulate inflation.
Reasons for Inflation to Peak in Mid-Year 2022
1. “[February’s] NFIB [small business] report was really encouraging. Both wage and pricing intentions have finally rolled over. Firms are stepping up capex plans and curbing hiring intentions. And the inflation stresses from the mini-inventory cycle are in the rear-view mirror.” – David Rosenberg, former Merrill economist, on Twitter
2. Wages are rising due to the shortage of labor as participation rates drop, but in the future post-pandemic economy, eligible workers return to the workforce, including early retirees as inflation drains savings. Also, as sited in the NFIB small business report, wage increases, which have been the highest among the lowest tier of economic earners, are slowing.
3. A peak in the price of crude oil. While the price of crude oil is excluded from Core PCE, higher energy and gas prices directly impact wage gains and input costs. The reasoning for higher prices in oil, gas and electricity is that the oil market feels like a runaway train, speeding toward $130 a barrel or even higher, and in oil, OPEC+ is behind the price hike, adding too few barrels too slowly, allowing inventories to decline to low levels.1
Oil balances are a lot tighter than the International Energy Agency thought, as refineries and petrochemical plants in China and Saudi Arabia report higher thruput or lower crude balances. The group published a recent report, revising historical oil demand back to 2007. The revision, 2.9 billion barrels of additional demand, is huge. Therefore, estimated stockpiles of 660 million barrels of surplus that the IEA saw a month ago have evaporated. The demand revision now estimates global oil stockpiles fell below their year-end 2019 levels.1
Ed Morse, a contrarian, and the long-time head of commodity analysis at Citigroup, Inc,. told clients to sell December 2022 oil contracts at $82.39, before the Russian invasion of Ukraine and the spike in crude oil prices. “Today everyone seems bullish in the oil market, just like 2008 when Brent crude prices hit a record high of $150 a barrel, only to crash a few months later.”2 Morse agrees today’s oil market is tight and Russia-Ukraine war has escalated prices, but he anticipates a change in the second half of 2022. In his analysis, the market will shift from tight to surplus in the spring of 2022. The shift is due to rising production from OPEC+, the Permian Basin and other U.S. shale basins, plus Canada and Brazil. To reinforce Morse’s argument, Conoco Phillips announced Permian alone may add 900,000 barrels a day in 2022. An Iran and U.S. agreement could add more oil, and Mideast oil countries, in view of over $100 in oil prices, are expected to add to output a total of 3 million barrels. The spring is worth watching for signs of more supply. Note, the Brent December 2022 futures price was $95 on March 11, 2022. The front-end prices could possibly decline below $100 a barrel in the near future, reducing December futures below $90.
The costs of energy as a percent of the average consumer wallet has declined significantly since the last two times crude oil rose to $100 or more. This fact is due to the rise in wages and household income since 1980, and the previous peak in crude prices at over $100 in 2008. While painful for low-income families, current oil prices are not expected to derail the economic recovery from Covid.
4. DeepMacro research uses alternative datasets to gain lead time of key economic indicators. For inflation, they combine consumer prices, producer prices, trader outlook, sentiment expectations and other indicators. In the other category, they point out a collapse in waiting times for truck drivers across the country, indicating supply chain tightness is easing (from Fundstrat research, Feb. 15, 2022). The number of ships waiting at Long Beach has decreased. Shipping rate premiums have also declined some. The NY Fed reports a surprise decrease in short and medium-term inflation expectations, i.e., 1-year 5.8% from 6.0%, monthly 3.5% from 7.0%. Market based inflation indicators (implied inflation) over 5-and 10-year spans remain elevated, but off November highs.
Wholesale prices rose significantly in March, up 0.8% month-to-month (less than the 1% jump in February) and 10% over the last year (same as February). Wholesale are list prices and as supply increases so do discounts from list prices in coming months.
5. A large number of month-to-month changes in Core PCE components, from the February CPI report, with the largest percentage change in October, November, December, and January, slowed in February 2022 (see minus signs in Table I).
Table I
Percent Change in Core CPI for All Urban Consumers
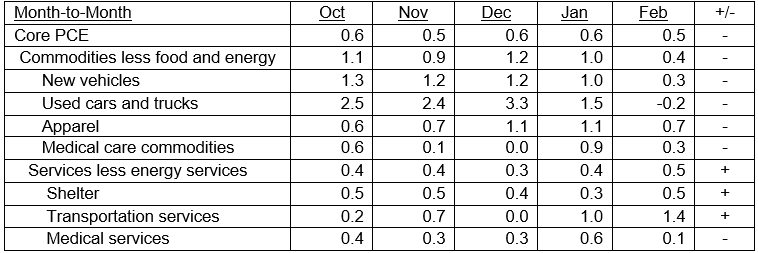
The Federal Reserve is basically of the view that the current inflation is too high, but should normalize over time. Core PCE and sticky CPI are expected to recede to 3.0% to 3.5% by late 2022 or in early 2023 and decline further in 2024 (see Chart I and Table I).
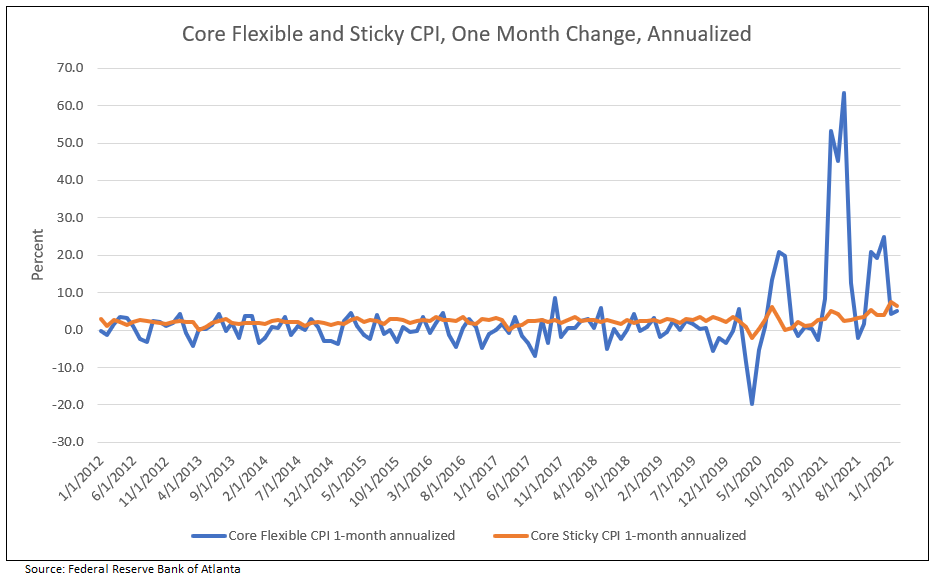
Core Flexible Price Peaked in Summer of 2021
Chart I
Housing Continues to Be Strong Driver of Inflation
Rent and owners’ equivalent rent (OER)—the amount of rent equivalent to the cost of ownership—are among the most important components of the Consumer Price Index (CPI) and the personal consumption expenditures (PCE) price index.3
The Dallas Fed forecasting model shows that rent inflation and OER inflation are expected to increase materially in 2022 and 2023. Given their weights in the core PCE price index, rent and OER together are expected to contribute about 0.6 percentage points to 12-month core PCE inflation for 2022 and about 1.2 percentage points for 2023.3
These forecasts also suggest that rising inflation for rent and OER could maintain the overall and core PCI and PCE inflation rates above 2.5% or even 3% percent in early 2023, when current supply bottlenecks and labor shortages may have subsided.
Conclusion
The following charts illustrate how cycle lows in TIPs yields forecast lows in the nominal 10-year yield minus inflation.
Chart II
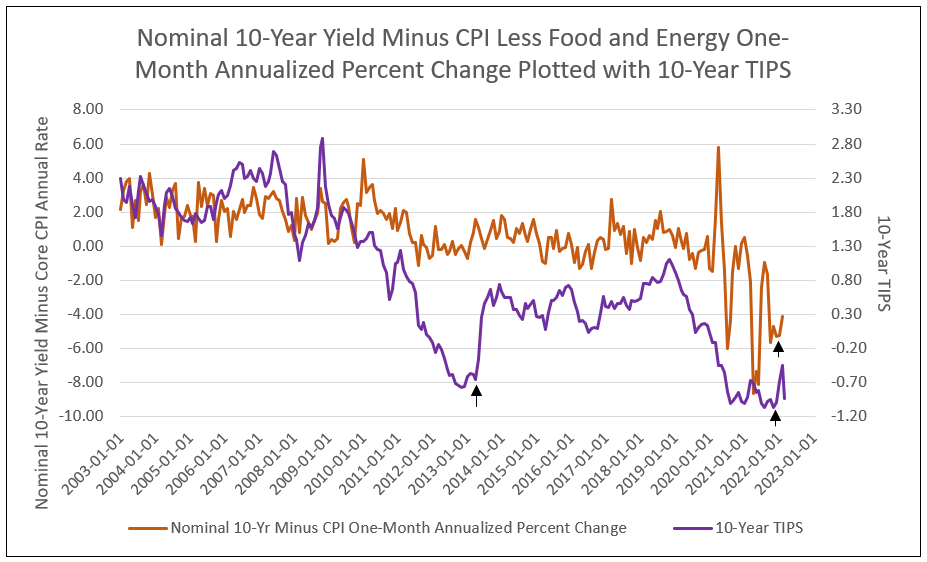
Chart III
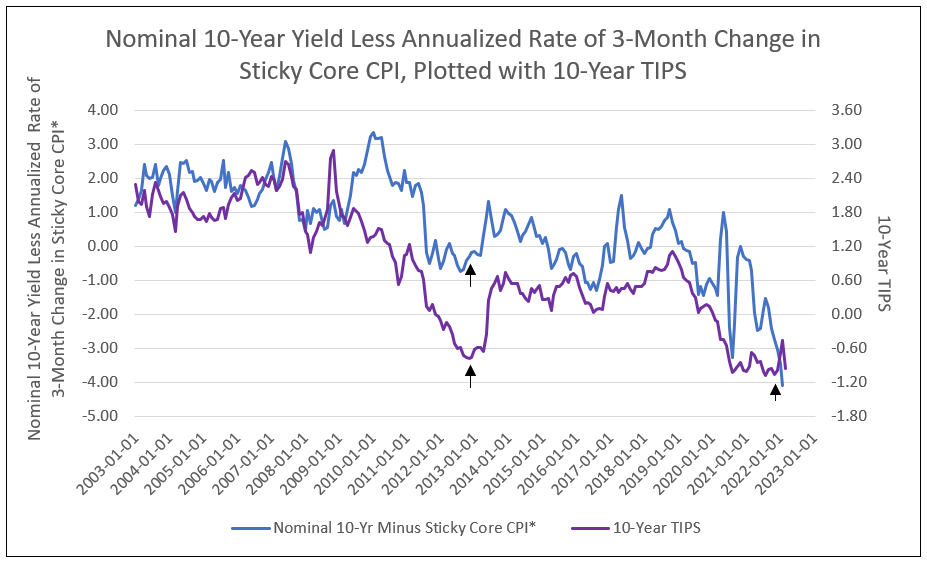
*Sticky Price Consumer Price Index Less Food and Energy, Monthly, 3-Month Annualized Percent Change, Seasonally Adjusted. The Sticky Price Consumer Price Index (CPI) is calculated from a subset of goods and services included in the CPI that change price relatively infrequently. Because these goods and services change price relatively infrequently, they are thought to incorporate expectations about future inflation to a greater degree than prices that change on a more frequent basis. Source: St. Louis Fed
We conclude the Federal Reserve opinion that the current rise in inflation is too high, and the forecast for a peak in inflation in 2022 which will recede by 2023, is correct.
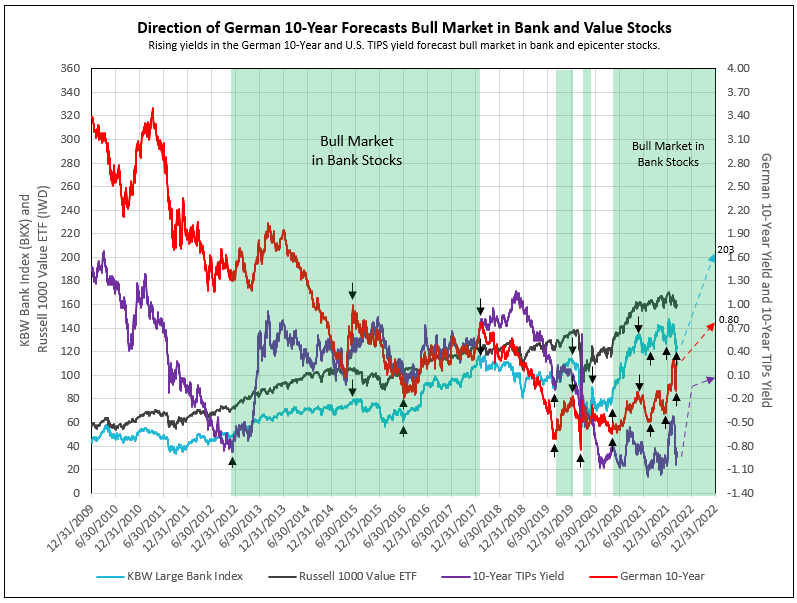
Bull Markets in Bank Stocks
- Since 2015, the bull markets in bank stocks began with a cycle low in the German 10-year, confirming a low in the U.S. 10-year yield (see Chart IV).
- The first leg of bull market in bank stocks began in October 2020 and ended in mid-May 2021, as the German 10-year yield reached its peak of -0.11%.
- An intermission occurred between legs from May to July/August 2021, as the German 10-year yield declined to its cycle low.
- The next upward leg of the bank bull market began in July 2021, as forecast by the German 10-year recovering from a negative -0.34% to a positive yield of 0.34%.
- The anomaly in the yield curve, resulting in the flatting of the 10 minus 2-year spread (threat of recession), is due to the short-term rise in implied inflation, and was reflected by a steep decline in the 10-year TIPS yield approaching record negative COVID lows. At the same time, the German 10-year yield continues to increase above its prior peak to a positive 0.34%, indicating, in our opinion, the TIPS yield will recover toward zero. The result is a recovery in the nominal yield to new highs and steepening the yield curve in coming months. The spread between the 10-year nominal German and real U.S. TIPS yields of 131 basis points on March 14, 2022, is at record and unsustainable levels (see Chart IV).
- With the TIPs yield at -0.95% and headed toward zero, the nominal 10-year rises to 2.4% or higher in 2022, steepening the yield curve. Banks stocks (BKX) offer a 64% appreciation potential (see Chart IV).
- The price change to March 14, 2022, for the average of 200 bank stocks followed by IDC Financial Publishing (IDCFP), was up 15.3% from the end of the intermission buy on July 19, 2021 and up 3.2% from the December 1, 2021 buy add.
Chart IV
1 OPEC+ Must Fix Its Million-Barrel Supply Gap, IEA Says
2 What If Goldman Is Wrong and a Lonely Oil Bear Is Right?
3 Surging House Prices Expected to Propel Rent Increases, Push Up Inflation
To view all our products and services please visit our website www.idcfp.com. For more information about our ranks, or for a copy of this article, please contact us at 800-525-5457 or info@idcfp.com.
John E Rickmeier, CFA
President
jer@idcfp.com
Robin Rickmeier
Marketing Director