Understanding the Treasury Yield Curve
Misunderstandings and Predictions Made by Stock Market Talking Heads
- On March 30, 2022, the 2-year T-Note yield rose above the 10-year, inverting the yield curve and forecasting recession in 12 to 18 months.
- If the 2-year yield is more than the 10-year, how can banks make money paying depositors a 2-year yield equivalent and charging a loan yield compensate with the 10-year yield?
Chart I
Correlation of 10-Year Less 2-Year Spread to ROEA or COD Supports Increases in Both
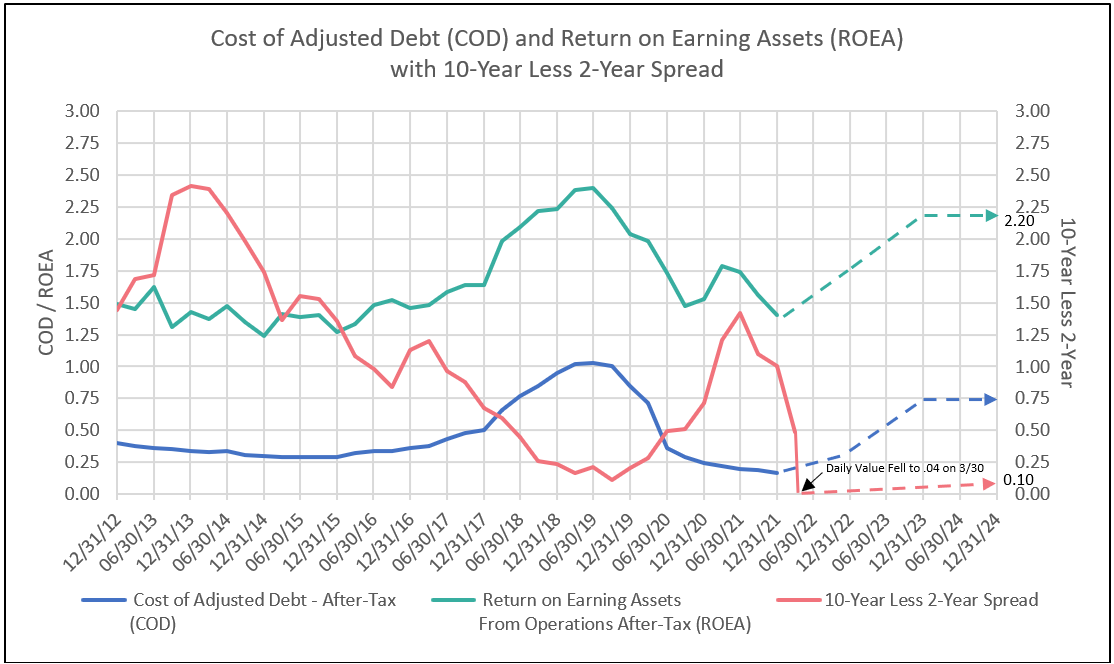
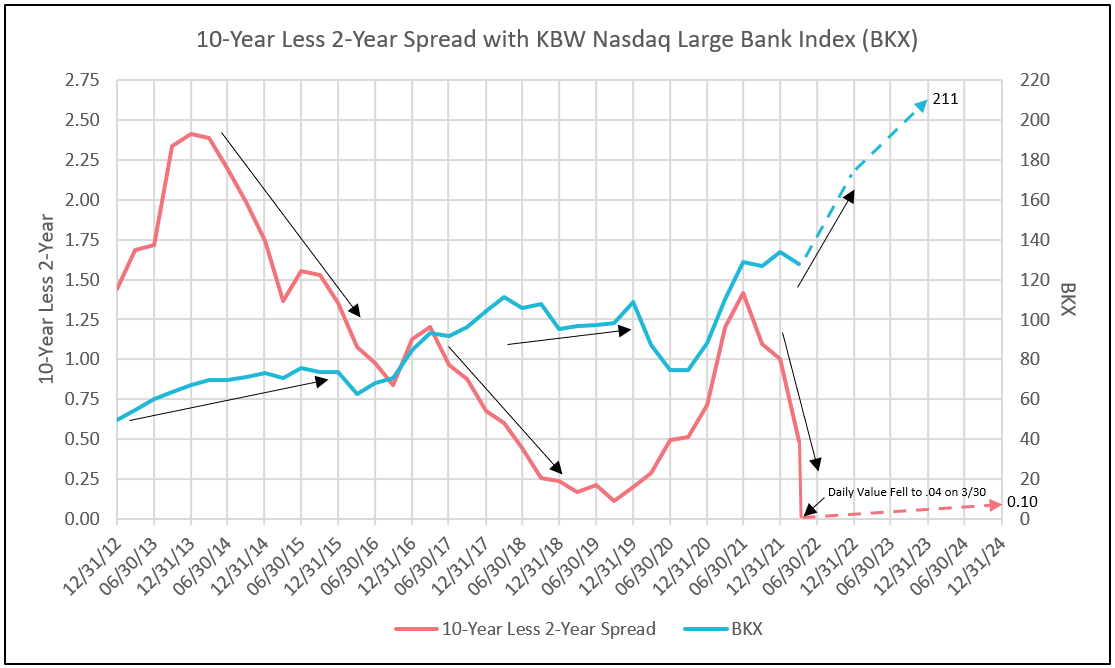
Chart II
Positive Correlation Between 10-Year Less 2-Year Spread
and Bank Stock Prices (BKX) Provides an Environment for Higher Bank Stock Prices
Understanding the Yield Curve with Inflation in Backwardation1 Confusing the Conclusions About How the Nominal Yield Curve Impacts the Economy
- The “real” or TIPS interest rate curve today remains positively sloped, as opposed to 2006 and 2019, when the “real” TIPS yield curve was deeply inverted like the nominal yield curve, forecasting recession.
- Currently inflation curves are in deep backwardation (spot far higher than future inflation). This implies short run inflation factors, such as supply problems, are temporary, while wage gains and housing costs are far more secular.
- Nominal yield = “real” or TIPS yield plus implied “future” inflation rate. For a recession forecast, “real” rates need to invert. Currently, the “real” or TIPS yield curve is normal or positively sloped, with a negative 1.26 basis points on the 2-year, a negative 0.92 on the 5-year, a negative 0.52 on the 10-year and a negative 0.05 on 30-year maturity.
- In conclusion, the yield curve is confusing due to inflation expectations causing inflation backwardation – or while the nominal yield curve experienced a limited inversion, the “real” curve remains normally sloped (see Table I).
Table I
Implied Inflation in Backwardation

Other Misconceptions During a Rise in the Fed Funds Rate
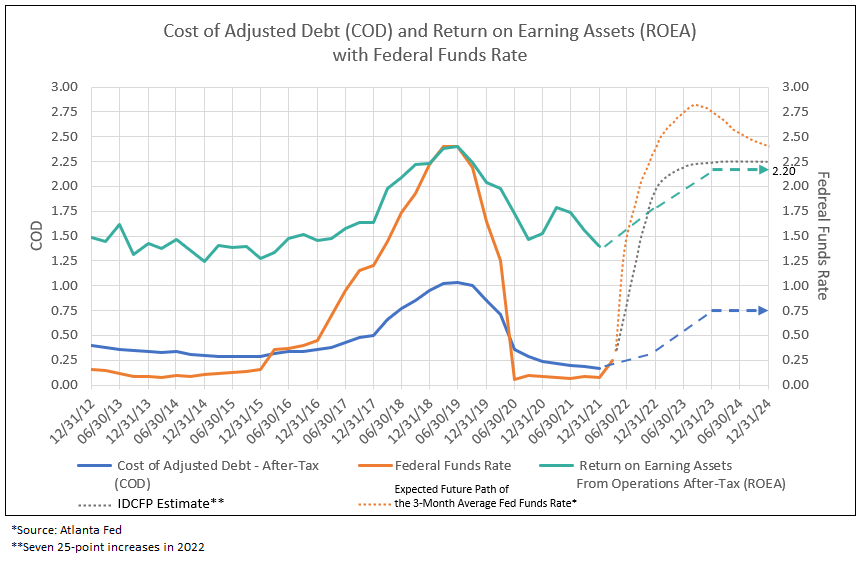
Another misconception is bank after-tax cost of funds increases more rapidly than the after-tax operating return in a period of a rising Fed funds rate. As illustrated in Chart III below, the Fed funds rate began to rise in 2016 and reached a peak in 2018. In 2016 and 2017, despite an increase in the Fed funds rate from near zero to 125 basis points, the after-tax cost of debt (COD) rose from 29 to 50, a 21-basis point increase. Operating return after-tax (ROEA) increased from 127 to 164, or 37 basis points. Therefore, the leverage spread (ROEA minus COD) increased 16 basis points despite a sharp rise in the Fed funds rate.
In 2018, the Fed funds rate increased from 125 to 240 basis points. COD rose from 50 to 95, or 45 basis points. ROEA increased from 164 to 223, an additional 59 basis points. So, again, with ROEA at +59 and COD at +45, the leverage spread rose by 14 basis points despite the sharp rise in the Fed funds rate that year (see Chart III).
Chart III
Forecast of Bank Profitability
Currently IDC Financial Publishing (IDDFP) forecasts of one-quarter point increases in the Fed funds rate will reach 200 basis points in 2022. The Atlanta Fed’s mean forecast is for a rise to 250 basis points. In 2023, we expect the rate to level off at 225 basis points (see Charts III & IV).
Like from 2016 to 2017, this year bank COD would increase but by only 16 basis points due to excess liquidity built into the banking system today. ROEA would recover 36 basis points to 176. The leverage spread would widen by 20 basis points.
Similar to 2018, in the year 2023 bank COD is forecast to increase 42 basis points. ROEA is expected to rise to 225, up from 176, or add 49 basis points, exceeding the increase in COD. Leverage spread margin would again increase by 7 basis points (see Charts III & IV, and Table II).
Table II
Two Misconceptions Eliminated or Reduced in Importance
- The nominal 2-year increasing to or above than the 10-year yield, or this inversion of yields, does not forecast recession until the 2-year TIPS exceeds the 10-year “real” TIPS yield curve.
- Despite the significant rise in the nominal 2-year relative to the 10-year yield, bank profitability in 2022 and 2023 increases, as supported by the higher forecast of leverage spread (ROEA less COD).
The Average Bank Stock Offers 74% Appreciation Potential to Year-End 2023
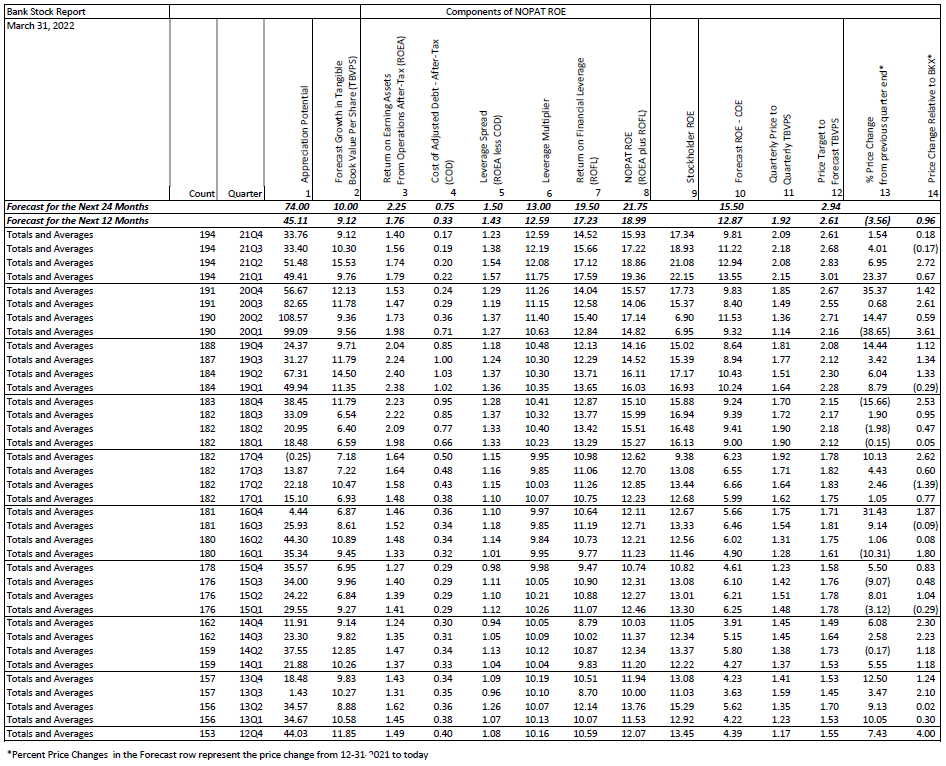
In the next two years, banking financials are expected to improve dramatically based on IDC Financial Publishing‘s (IDC’s) NOPAT ROE rising from 15.9% in the fourth quarter of 2021 to a new 10-year high of 21.8% in the fourth quarter of 2023. What fundamentals are driving this secular improvement in profitability?
IDC’s non-traditional approach to financial ratios, modeling, forecasting, and valuation offers a unique perspective to bank stock selection. The following description demonstrates how we are different and offers an explanation as to why and how the secular improvement is occurring in banking, driving higher price-to-tangible book valuations. By using the following unique ratios developed by IDC to forecast a bank’s appreciation potential, we demonstrate how our approach is superior to the standards of most bank analysis.
The Traditional ROE Equation and the Problem with the Bank Stock Analysis
The traditional ROE equation simply divides net income by the average of common stockholder’s tangible equity capital. The stockholder ROE, as a bottom-line measure of profitability, fails to reflect the true nature of asset value. Additionally, the traditional components of the ROE percentage – net interest margin, net income return on assets (ROA), and resulting stockholder ROE – confuse the source of net income by subtracting cost of funding too early in the analysis. Bank common stock evaluation is unable to separately compare operating and financial returns. Finally, accounting for the loan loss provision and not adjusting net income for the increase on the loan loss reserve, fails to reflect the true cash flow to earnings used to value a bank stock.
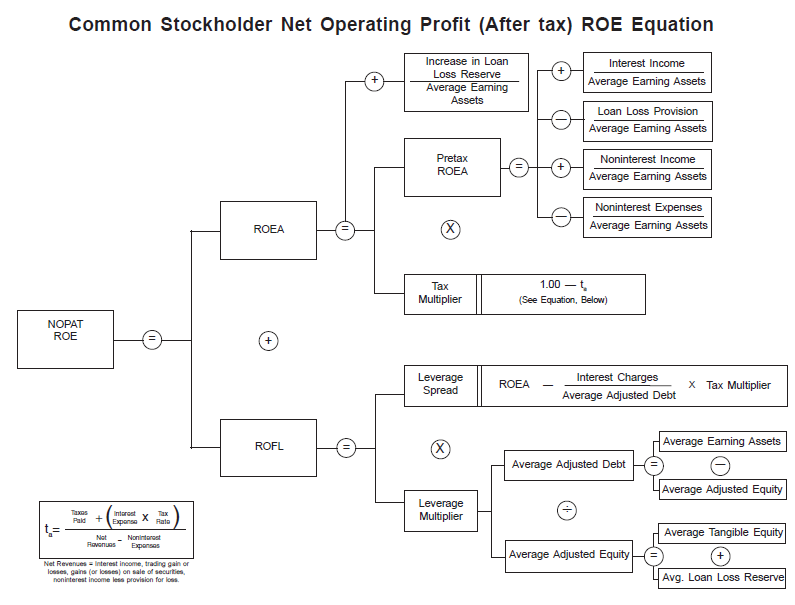
The NOPAT ROE Equation (see Diagram I)
In contrast IDC uses the NOPAT ROE equation to express ROE as a sum of two components, operating return (ROEA) and financial return (ROFL). ROEA equals the return that the bank earns on loans, securities, cash equivalents and other earning assets, after operating expenses, loan loss provision, and taxes (but before interest expenses), and then adding back the increase in the loan loss reserve. ROEA focuses on the operating strategy, which identifies returns from investments, loans, and non-interest income sources net of noninterest expenses and taxes, plus the increases in the loan loss reserve, all as a percent of earning assets. Return on financial leverage (ROFL) measures financial returns or the after-tax cost of deposits and debt required to finance earning assets not funded by tangible equity and the loan loss reserve. ROEA plus ROFL equals NOPAT ROE. See our example below (Table II) that details the components of NOPAT ROE for all banks analyzed by IDC.
Valuations Components – An Example of Bank Valuation
The key components required by IDC to value a bank are the forecast of tangible book value per share (TBVPS), NOPAT ROE, and cost of equity capital (COE).
Forecast growth in TBVPS is based on the recent growth rates for TBVPS, which is enhanced by increased share buy-backs. The annualized growth in average TBVPS for the sum of 194 banks followed by IDC in the fourth quarter of 2021 was a reported 4.1% and expected to increase to 9.1% in 2022 and an additional 10% in 2023.
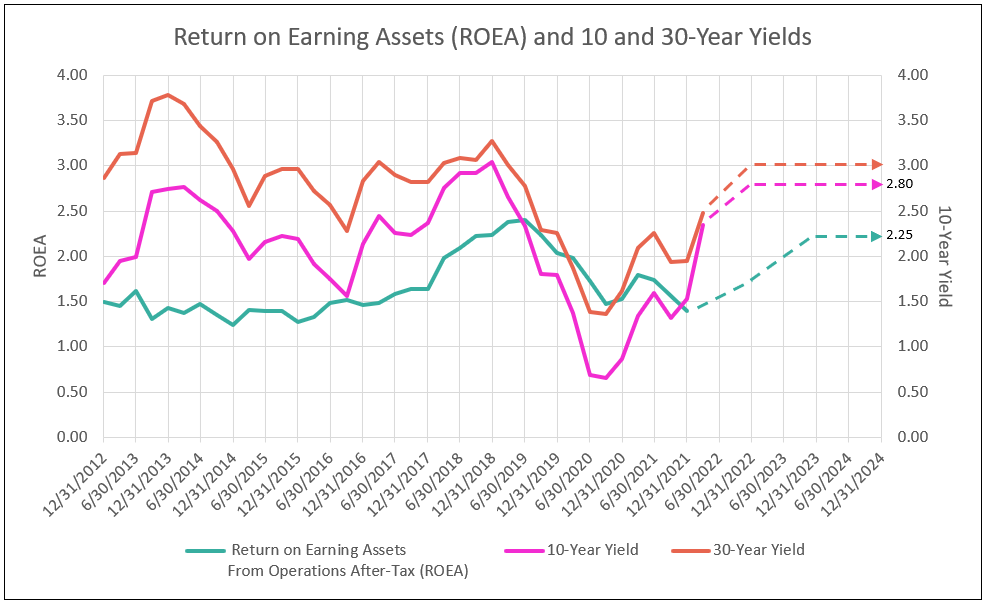
The components of NOPAT ROE are the operating returns (ROEA) plus the financial returns (ROFL). ROEA measures the operating profits after tax, excluding funding costs, but includes the increase in the loan loss reserve to capture the true cash flow from operations. In the next two years, ROEA is expected to improve from 1.40% at year-end 2021, to 1.76% in 2022Q4 and 2.25% by year-end 2023. The significant increases between 2016 and 2018 in the Fed funds rate plotted in Chart III and the 10-year T-Note yield in Chart IV both provide a blueprint for estimated rate and yield increases, and the impact on ROEA and COD, in 2022 and 2023.
To compute the financial return (ROFL), IDC next forecasts the cost of adjusted debt after tax (COD), which is the after-tax funding cost divided by the earning assets less tangible equity and the loan loss reserve. COD fell to 0.17% in 2021Q4. IDC forecasts banks will add 16 basis points to COD by December 2022, increasing after-tax cost of debt to 0.33%, followed by an additional increase to 0.75% by December 2023, all due to the expected increase in the Fed funds rate (see Chart III).
Chart IV
Subtracting COD from ROEA provides the leverage spread, which is expected to increase from 1.23% at year-end 2021 to 1.43% in 2022Q4, and then expand further to 1.50% by December 2023.
The most dramatic secular change in banking is the leverage multiplier, which is forecast to rise from 12.6-times in 2021Q4 to 13.0-times in 2023Q4. The leverage multiplier is the product of the earning assets excluding tangible equity and the loan loss reserve divided by the equity and loan loss reserve.
Return on financial leverage (ROFL) then equals the leverage spread times the leverage multiplier. In December 2022, a forecast leverage spread of 1.43% times a record high leverage multiplier of 12.6 provides a favorable forecast ROFL of 17.23%. Adding the forecast ROEA of 1.76% to the forecast ROFL of 17.23% provides a forecast NOPAT ROE 18.99% by 2022Q4.
For December 2023, a forecast leverage spread of 1.50%, times a record-high leverage multiplier of 13, provides an even more favorable ROFL of 19.5%. Adding the forecast ROEA of 2.25% to this forecast ROFL results in a forecast NOPAT ROE of 21.75% for 2023 (see Table II).
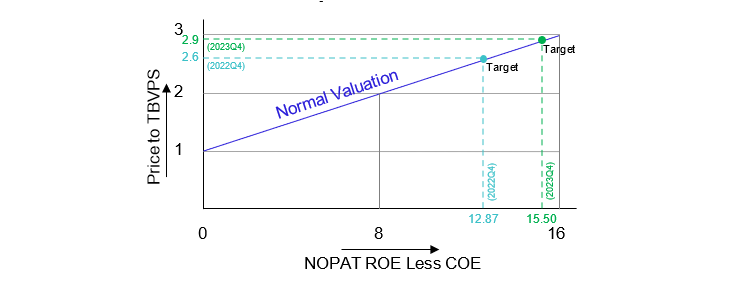
The NOPAT ROE less the cost of equity capital (COE) provides the price-to-book estimate and appreciation potential (see Chart V and Table II, columns 11 & 12).
What other industry realizes a secular increase in ROE from 15.93% to 21.75% in 2 years like banking?
An increase of 9.1% in TBVPS in 2022, and another 10% in 2023, coupled with a dramatic improvement in ROE to 21.75% creates accelerating EPS growth, and with a terminal p/e of 13.8-times, from current p/e of 9.6-times, provides a 74% appreciation potential for the average bank stock by year-end 2023. The estimated target price to forecast TBVPS of 2.94 in December 2023 is a function of the forecast NOPAT ROE less the cost of equity capital (COE, estimated at 6.2% for December 2023) with the COE based on the forecast of 3% in long term U.S. Bond yields at year-end 2023, plus one-half the bond yield adjusted for the specific risk of a bank. The current price to forecast fourth quarter 2022 TBVPS is 1.92-times (see Table II and Chart V).
Chart V
Value Added by Rise in ROE Relative to COE
Performance History of Valuation of the Average Bank Stock
The history of bank stock valuation, provided by appreciation potential of bank stocks from 2012 to 2021, demonstrates its accuracy. The major bull market in bank stocks began on December 12, 2012, and lasted to February 15, 2018, with the KBW Large Bank Index appreciating 130.5% over that 5-year, 2-month period, or 17.4% a year.
Based on IDC’s valuation for the average bank stock, numbering 153 in 2012 and 182 in early 2018, the average capitalization weighted 12-month appreciation potential began at 44.0% in 2012, was 44.3% in June 2016, and ended 2016 with only 4.4%. By 2017Q4 appreciation potential reached a negative 0.3%, indicating full valuation. A second valuation measure, current price to current TBVPS versus forecast price to forecast TBVPS, provided a favorable spread from 2012 to 2017, except for year-end 2016 and 2017 when the current price to current TBVPS exceeded forecast price to forecast TBVPS, indicating full valuation (see columns 11 & 12 in Table II).
The current bank stock bull market began on October 29, 2020, with a 30% appreciation potential for the average bank stock. Despite a 68% appreciation in the KBW Large Bank Index from October 25, 2020, to March 27, 2022, another 45% appreciation potential in the BKX is forecast over the next 12 months and an additional 20.6% in 2023. The current bull market could well offer the same or greater opportunity seen in the last bank stock bull market from 2012 to 2018.
Method for Forecasting Price Appreciation Potential for a Bank Stock
Under normal bank financial conditions (pre-COVID), the key component of the NOPAT ROE forecast was the operating return (ROEA). Forecast ROEA a year ahead equaled the greater of the annualized last quarter or last four quarters of ROEA. Cost of debt (COD) was set equal to the latest annualized quarter value. The resulting leverage spread (ROEA less COD) was then multiplied times the latest reported leverage multiplier, providing return on financial leverage (ROFL). The forecast NOPAT ROE equaled the ROFL plus ROEA. Finally, the forecast NOPAT ROE less the cost of equity capital (COE), based on 3% long U.S. T-Bond yield, determined the forecast price to forecast TBVPS (see Chart III). Given the forecast of TBVPS was the greater of 1-year or annualized latest quarter growth, the forecast price-to-TBVPS times the forecast TBVPS provided a target price or appreciation potential.
Beginning in the second quarter of 2020, however, the method of forecasting changed due to the significant decline in reported operating returns (ROEA) due to COVID. From 2020Q2 to 2021Q4, the forecast one-year ahead ROEA was estimated as the mid-point between the current quarter value and the ROEA for 2019Q4, given the ROEA for the last reported quarter was less than 90% of 2019Q4 value. For those banks with ROEA 90% or greater as a percent of reported ROEA in 2019Q4, the forecast was based on the ROEA reported for the most recent quarter. This method allowed for cyclical recovery in the operating return or, if above secular trend, a continuation of that trend. The current ROEA forecast is consistent with a 2.00% Fed funds rate at the end of 2022. The ROEA forecast for 2023 of 2.25% is based on a 2.25% to 2.50% Fed funds rate in 2023 and a 2.8% yield on the U.S. 10-year yield.
Cost of debt (COD) was increased for the expected hike in the Fed funds rate (see Chart III). The resulting forecast leverage spread times the latest reported leverage multiplier provides the forecast ROFL. Adding forecast ROEA and forecast ROFL equals forecast NOPAT ROE. The forecast NOPAT ROE less the cost of equity capital (COE) provides the price-to-book estimate and appreciation potential (see Chart V).
Accuracy of Valuation Line in History
The following charts published by IDCFP in late 2017 (Chart VI) and late 2019 (Chart VII) highlight valuation data from the previous quarters, during periods of peaks in bank bull markets. Market capitalization to equity represented the price to tangible book value. The valuation line in history demonstrates the accuracy of this method using the normal valuation line to forecast price-to-book value given the spread of NOPAT ROE less COE.
Chart VI
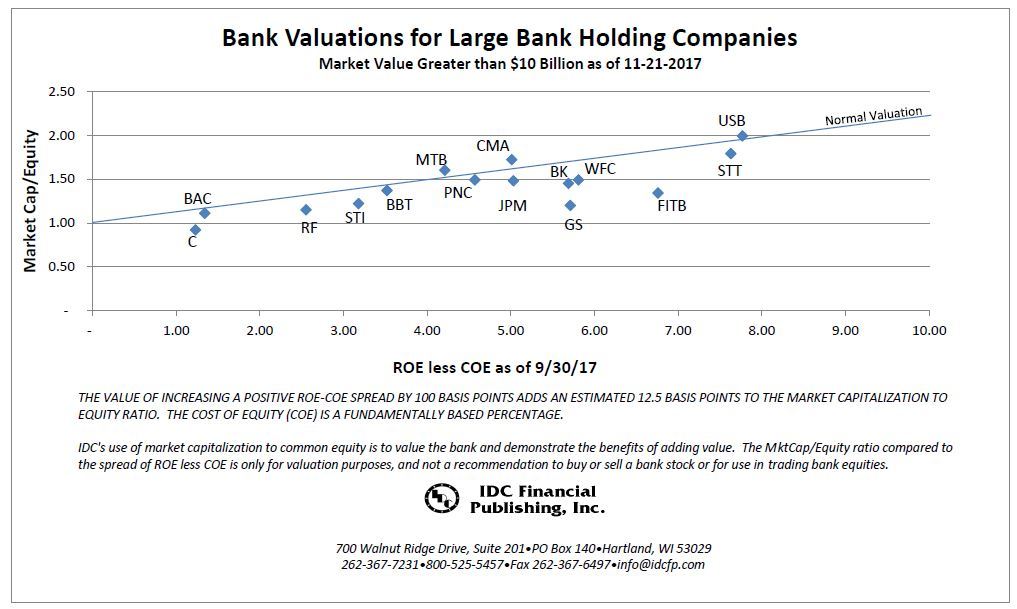
Chart VII
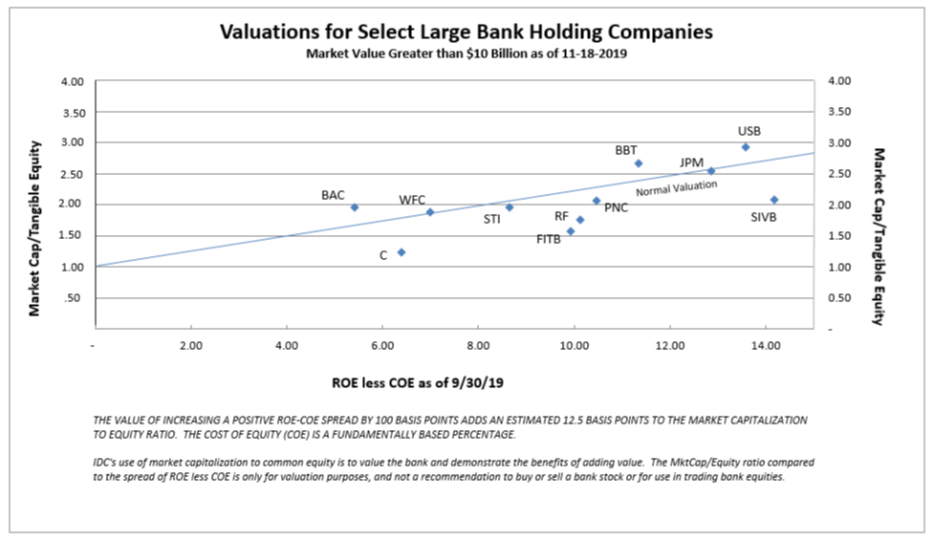
Diagram I
Let IDC provide you the value and financial history of your favorite bank stock. For you to better understand our process of valuation, we offer a free, one-time analysis of one of the 202 banks in our bank analysis database. Simply send your request with the bank stock symbol to info@idcfp.com.
To inquire about IDC’s valuation products and services, please contact jer@idcfp.com or info@idcfp.com or call 262-844-8357.
John E Rickmeier, CFA
President
Robin Rickmeier
Marketing Director