Major Bank Stock Price Correction Reflected the Forecast of a Recession
“The correction I failed to see coming provides the next opportunity, with no recession in sight.”
– John Rickmeier
Beginning February 9, 2022 to date, a major bank stock price correction occurred as a result of the inverted yield curve that forecast a recession.
The inverted yield curve between the 10-less-2-year T-Note yields was due to the backwardation of implied inflation. Since implied inflation peaked in March, despite current inflation reports on CPI and PPI, the yield curve returned to a positive slope. The NY Fed reports their survey of inflation expectations for the medium term (2023-2024) eased to 3.4%. The survey also indicated medium year-ahead household spending growth expectations jumped by 1.3% to 7.7%, marking a new high and largest month-to-month increase in the series. From IDCFP’s point of view, no recession is on the horizon in 2022 through 2024.
Bank Stocks Outperform Value Stocks as Defined by U.S. and Confirmed by the German 10-Year Yield Determining Bank Stock Bull Markets
Chart I
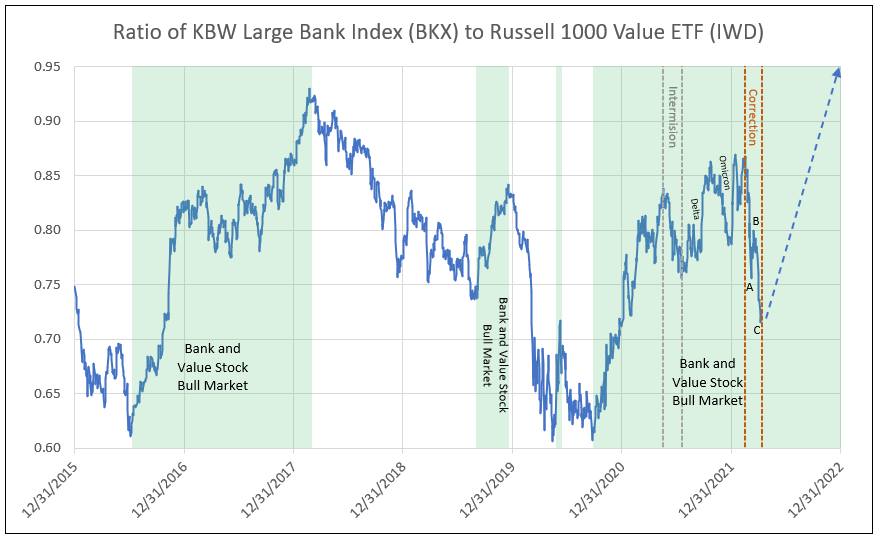
- The prior major bank stock bull market occurred from June 2016 to February 2018 (see Charts I & III).
- The current bank bull market began in October 2020 (see Charts II & IV).
- The intermission occurred from May 17 to July 19, 2021 (similar to the intermission in the 2nd quarter of 2017).
- The second leg of the current bank bull market occurred from July 19, 2021 to February 9, 2022.
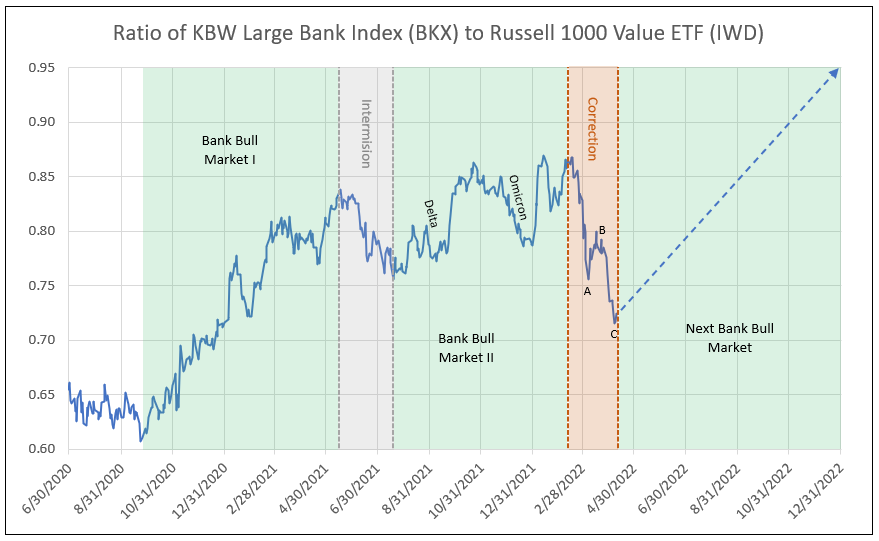
- The A-B-C correction occurred in the BKX from February 9 to April 11 of 19% (see Chart II).
A) February 9 to March 7, 2022 (down leg)
B) March 7 to March 22, 2022 (up leg)
C) March 22 to April 12, 2022 (down leg)
Technicals:
- KBWB, ETF on a DeMark 13 Buy Signal followed by a Countdown at a 9 Buy Signal
- KRE on a DeMark Countdown at 9 Buy Signal
- TLT 20-year Bond ETF price closing in on a DeMark Buy Signal (peak in yields); a Countdown of 6 out of 9
- TNX 10-year Bond yield at a DeMark 13 Sell Signal (peak in yields)
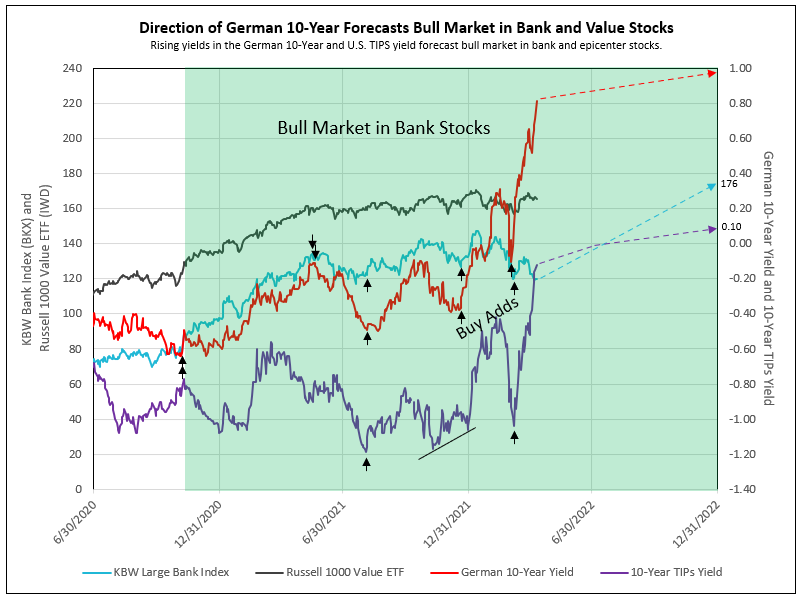
The next opportunity is the forecast for BKX for 2022 to recover to 176, up from 120 on April 12, or a 47% increase (see Charts III & IV).
Chart II
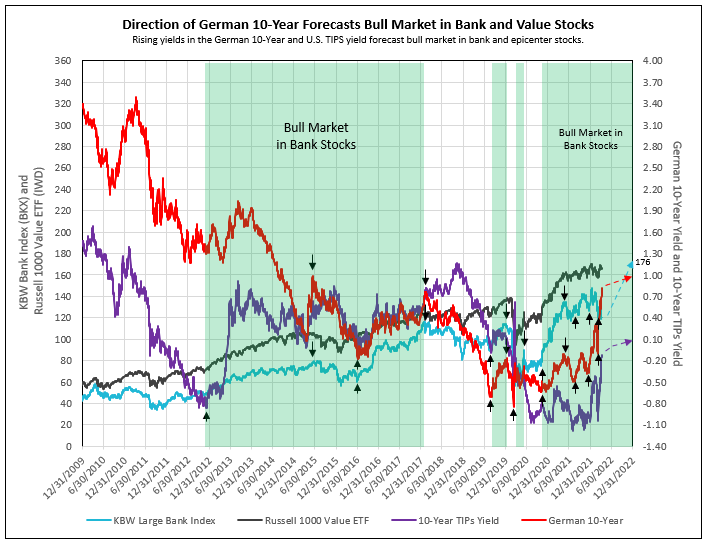
Importance of 10-Year Yields in the Cycle of Bank Stock Performance
- The low in the 10-year U.S. TIPS yield at year-end 2012 begins bank stock bull market.
- Peak and decline in German 10-year in February 2018 ends bull market despite the continued increase in the U.S. 10-year yield.
- Low and reversal in German 10-year in August 2019, March 2020, October 2020, and July 2021 began recovery in bank stocks.
Chart III
The bank stock bull market from October 2020 to-date had an intermission from May 2021 to July 19, 2021. This bull market had a buy-add in December 2021 and February 2022.
Lows in German 10-Year Yield Indicate Buy Adds
Chart IV
To view all our products and services please visit our website www.idcfp.com. For more information about our ranks, or for a copy of this article, please contact us at 800-525-5457 or info@idcfp.com.
John E Rickmeier, CFA
President
262-844-8357
jer@idcfp.com
Robin Rickmeier
Marketing Director