Inflation Peaks by Mid-Year 2022
The consumer price index for March 2022 increased 8.5% following a 7.9% annual gain in February. Gasoline and the March peak in oil prices drove half of the monthly increase and food was also a large contributor.
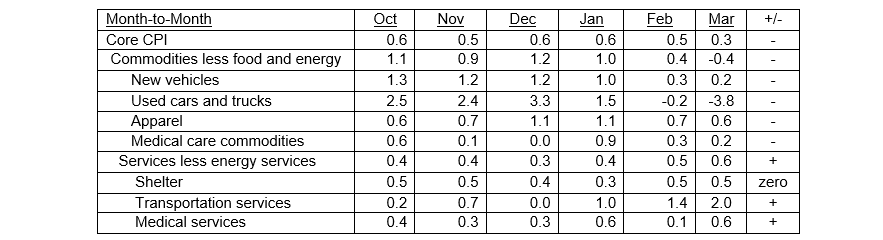
Excluding volatile food and energy components, core CPI increased 0.3% in March from a month earlier but was less than the 0.5% increase in February. Commodities less food and energy fell 0.4% versus a February increase of 0.4%, mostly due to the decline in used cars and trucks and new vehicle prices. Only the service sector rose month-to-month with shelter prices stable at 0.5% (see Table I).
The figures are “a welcome respite from the sustained heated core increases of late...fuel costs look to ease in response to the recent pullback in oil prices,” according to Sal Guatieri, Senior Economist at BMO Capital Markets.
One-Month Change in Core Flexible Price Peaked in Summer of 2021 and Fell 7.2% in March at Annual Rate
Chart I
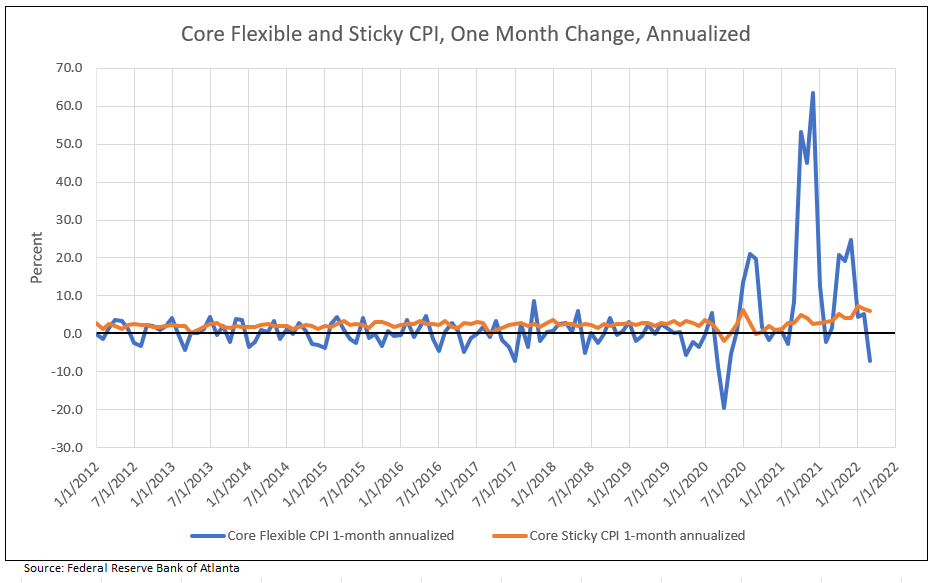
The Atlanta Fed’s sticky-price index CPI, (a weighted basket of items that change relatively slowly), increased 5.8% on an annual basis in March, following a 6.5% increase in February. On a year-over-year basis, the series is up 4.7%. The core sticky-price index (excluding food and energy) increased 6% (annualized in March) and its 12-month price change was up 4.6%.
The Federal Reserve is basically of the view that the current inflation is too high but should normalize over time. Core PCE and sticky CPI are expected to recede to 3.5% to 4.0% by late 2022 or in early 2023 and decline further in 2024 (see Table I).
Reasons for Inflation to Peak in Mid-Year 2022
1. Wages are rising due to the shortage of labor as participation rates drop, but in the future post-pandemic economy, eligible workers return to the workforce, including early retirees as inflation drains savings. Also, as sited in the NFIB small business report, wage increases, which have been the highest among the lowest tier of economic earners, are slowing.
2. CPI excluding food and energy declined month-to-month from 0.5 in February to 0.3 in March, the best reading since September 2021.
3. The March Manheim Used Vehicle Value Index of used car sales and prices indicated prices peaked in December and have been down three consecutive months (a key component to flexible CPI). Used car prices account for 1.4% of CPI, while new cars equal 0.4%. Prior to 2020, used car prices accounted for zero percent contribution. Without cars, CPI would have been 2% lower, so instead of 5-6%, it is really 3-4% in 2021.1
Manheim has a two-month lead on the contribution to “used car Core CPI,” declining from the peak contribution of 1.4% to 0.7%; a decline of 0.7% or 50% from the peak to May 2022.1
4. Freight rates are down 30% from Shanghai to major global cities.1
5. Backlog of ships is down to pre-September 2021 levels according to LA/LB reports.1
6. Cass Freight Index (U.S. goods) is negative year-over-year and leads CPI by six months.1
7. A peak in the price of crude oil. While the price of crude oil is excluded from Core PCE, higher energy and gas prices directly impact wage gains and input costs. The reasoning for higher prices in oil, gas and electricity is that the oil market feels like a runaway train, which increased to $130 a barrel, and in oil, OPEC+ is behind the price hike, adding too few barrels too slowly, allowing inventories to decline to low levels.2 Russia’s further invasion of Ukraine, as well as trade disruptions, sanctions, and private sector divestments from doing business in Russia, limit supply.
Ed Morse, a contrarian, and the long-time head of commodity analysis at Citigroup, Inc,. told clients to sell December 2022 oil contracts at $82.39, before the Russian invasion of Ukraine and the spike in crude oil prices. “Today everyone seems bullish in the oil market, just like 2008 when Brent crude prices hit a record high of $150 a barrel, only to crash a few months later.”3 Morse agrees today’s oil market is tight and Russia-Ukraine war has escalated prices, but he anticipates a change in the second half of 2022. In his analysis, the market will shift from tight to surplus in the spring of 2022. The shift is due to rising production from OPEC+, the Permian Basin and other U.S. shale basins, plus Canada and Brazil. To reinforce Morse’s argument, Conoco Phillips announced Permian alone may add 900,000 barrels a day in 2022. An Iran and U.S. agreement could add more oil, and Mideast oil countries, in view of over $100 in oil prices, are expected to add to output a total of 3 million barrels. The spring is worth watching for signs of more supply. Note, the Brent December 2022 futures price was $109 on March 13, 2022.
The cost of energy as a percent of the average consumer wallet has declined significantly since the last two times crude oil rose to $100 or more. This fact is due to the rise in wages and household income since 1980, and the previous peak in crude prices at over $100 in 2008. While painful for low-income families, current oil prices are not expected to derail the economic recovery from Covid.
8. The NY Fed reports inflation expectations reached a new high for the short-term, increasing to 6.6%, but eased for the medium-term to 3.7%. Median year-ahead household spending growth expectations jumped by 1.3% to 7.7%, marking a new high and largest month-to-month increase for the series – casting further doubt on the possibility of a recession.
9. Wholesale prices rose significantly in March, up 1.4% month-to-month (more than the 0.9% in February) and 11.2% over the last year. Core PPI was up 7.0% year-over-year, same as November and December 2021. Wholesale are list prices; as supply increases so do discounts from list prices in coming months.
10. Numerous month-to-month changes in Core PCE components from the March CPI report, with the largest percentage change in October, November, December, and January, slowing in February and March 2022 (see minus signs in Table I).
Table I
Percent Change in Core CPI for All Urban Consumers
Housing Continues to Be Strong Driver of Inflation
Rent and owners’ equivalent rent (OER)—the amount of rent equivalent to the cost of ownership—are among the most important components of the Consumer Price Index (CPI) and the personal consumption expenditures (PCE) price index.4
The Dallas Fed forecasting model shows that rent inflation and OER inflation are expected to increase materially in 2022 and 2023. Given their weights in the core PCE price index, rent and OER together are expected to contribute about 0.6 percentage points to 12-month core PCE inflation for 2022 and about 1.2 percentage points for 2023.4
These forecasts also suggest that rising inflation for rent and OER could maintain the overall and core PCI and PCE inflation rates above 2.5% or even 3% percent in 2024, when current supply bottlenecks and labor shortages may have subsided.
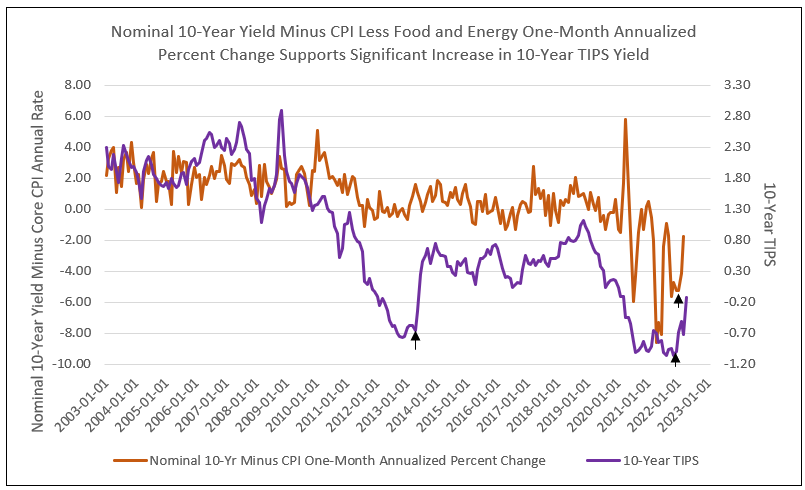
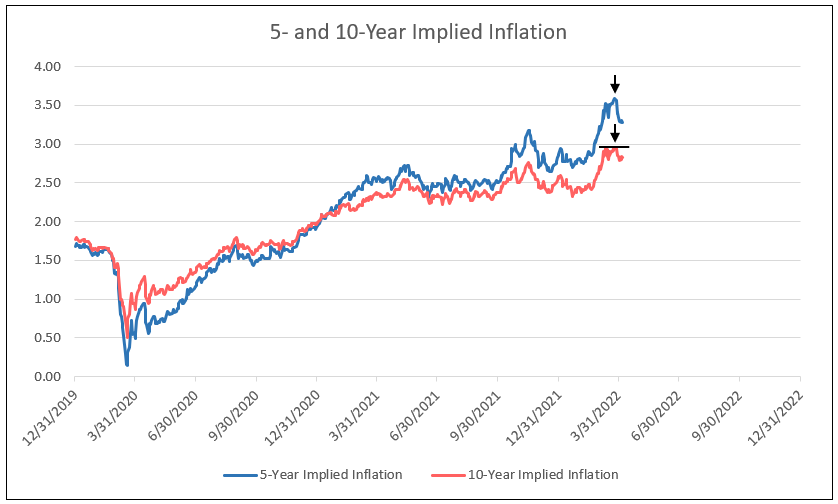
The following charts illustrate how cycle lows in TIPs yields forecast lows in the nominal 10-year yield minus core CPI inflation and the peak in implied inflation.
Chart II
Implied Inflation Peaks in March 2022
Chart III
Conclusion
We conclude the Federal Reserve opinion that the current rise in inflation is too high, and the forecast for a peak in inflation in 2022 which will recede by 2023, is correct.
1 Tom Lee’s FSInsight, of Fundstrat, April 13, 2022
2 OPEC+ Must Fix Its Million-Barrel Supply Gap, IEA Says
3 What If Goldman Is Wrong and a Lonely Oil Bear Is Right?
4 Surging House Prices Expected to Propel Rent Increases, Push Up Inflation
To view all our products and services please visit our website www.idcfp.com. For more information about our ranks, or for a copy of this article, please contact us at 800-525-5457 or info@idcfp.com.
John E Rickmeier, CFA
President
jer@idcfp.com
Robin Rickmeier
Marketing Director