Low in HYG and Ratio of HYG to LQD Forecasts the Low in the S&P 500 and Outperformance of Bank Stocks
Cycle lows in the High Yield Bond ETF (HYG) historically have occurred at the lows in the stock market (see Chart I). U.S. 10-year yield and high yield bonds have already priced the peak in inflation peak and future Fed funds rate increases.
Tom Demark is one of the leading stock price analysts, who, on March 24, 2020, called the low in the stock market. His technical capabilities have been successful across commodities, stock prices, bitcoin, and many other series with a regular price. DeMark consults with the leading money managers in the U.S.1
The technical picture from DeMark provides a signal on the 10-year yield (TNX), a daily buy on the price of the 20+ year Treasury Bond ETF (TLT), and a daily buy on investment grade bond ETF (LQD) and on the High Yield Corp Bond ETF (HYG, a bond market proxy for equities). Confirmation of buy comes from the Chaikin Money Flow reaching an extreme low.
Chart I
High Yield Bond ETF (HYG) Forecast to Reach a Low in May/June of 2022
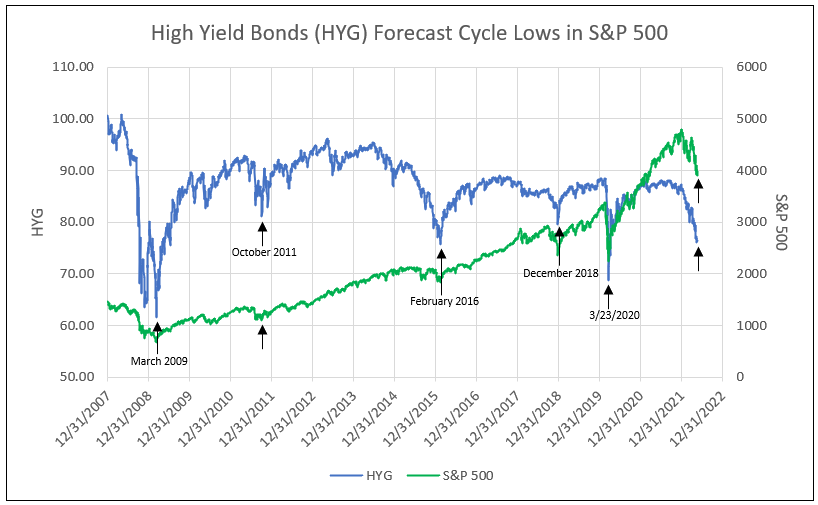
DeMark further indicated a potential cycle low in the S&P 500 around 3,850 followed by a “shocking’ rally to 4,400 or 4,500. In addition, on May 20, he signaled a buy in bank stocks. He also noted coming weaknesses in the energy complex and confirmation of the peak and decline in inflation.
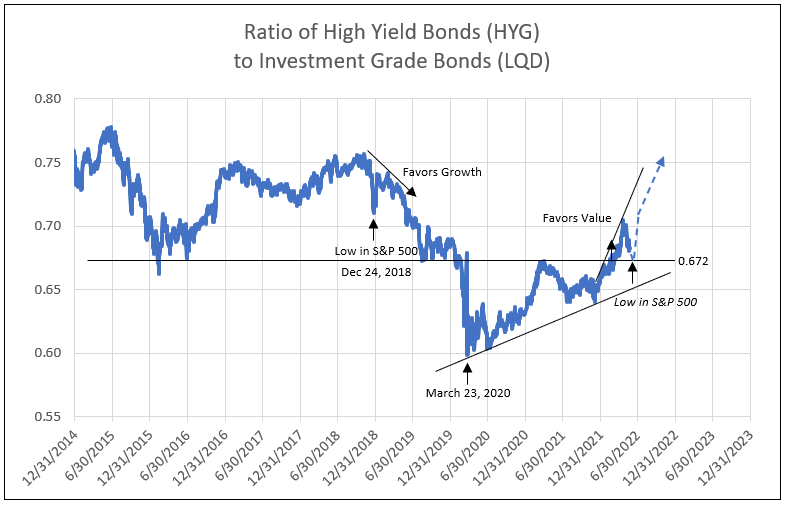
The sharp decline and potential recovery in HYG relative to LQD in May 2022 is similar to the sudden decline and recovery in December 2018. This V-shaped formation in HYG/LQD ratio, indicates a peak in expectations for further Fed fund increases, which are already priced into the market. Subsequent continued increases in the trend of the ratio HYG to LQD supports performance of value stocks. In December 2018, the V-formation was in a trend of a declining ratio, then favoring growth stocks (see Chart II).
Chart II
The S&P 500 in Correction
The current stock “correction” from the peak on January 4, 2022, at 4,804.5 to the low on May 19 of 3,858.9 was 19.7%, short of the threshold of a 20%-plus decline that determines a “bear market.” Worth noting is that, in the same period, the evenly weighted S&P 500 is down only 13%. Past recoveries from past “near miss” stock market corrections were substantial as illustrated in Table I.
Table I
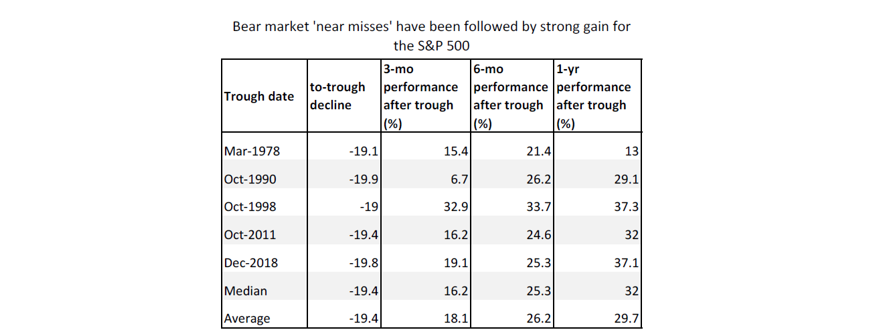
Source: Credit Suisse, Factset, Via CNBC
Major Bond ETFs Reach a Cycle Low
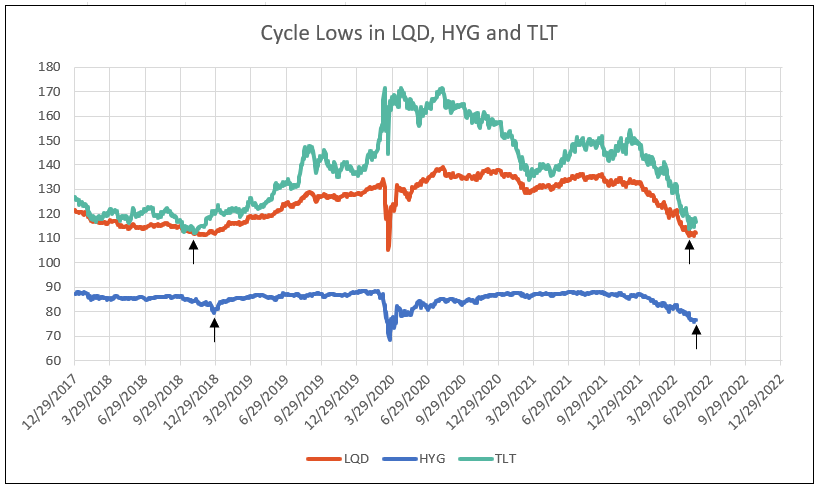
The prices of the 20+ year Treasury Bond ETF (TLT) and the Investment Grade Corporate Bond ETF (LQD) reached cycle lows on May 6, nearly equal to the cycle lows on October 29, 2018. On December 24, 2018, the High Yield Bond ETF (HYG) reached a cycle low, forecasting the low in the S&P 500. (See Chart III).
Given the technicals indicating a price low in these ETFs, a cycle low in the HYG is expected in May 2022. In anticipation of the coming low, the S&P and bank stocks have reached a point of exhaustion in selling and poised for a strong recovery.
Chart III
Inflation Peaks in the Second Quarter of 2022
One-month April core PCE, the Fed’s gauge on inflation, is expected to decline to 3.6% annual rate when reported on May 27. The year-over-year increase is forecast to fall to 3.6% by year-end 2022 and 2.4% by the end of 2023. After two 50 basis point increases in the Fed funds rate, Powell indicates further increases will be data dependent.
Structural Change in the Stock Market Favoring Value Stocks
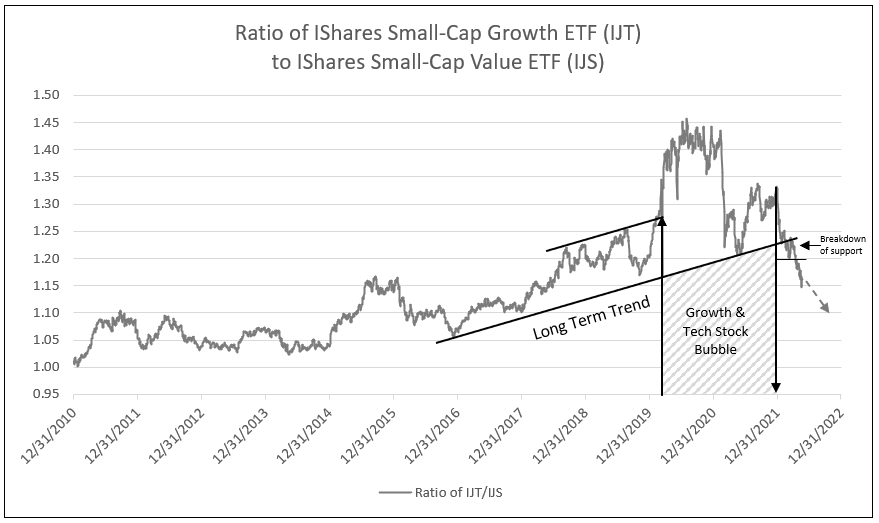
In late 2021, the peak and significant decline in Small-Cap Growth ETF (IJT) relative to Small-Cap Value ETF (IJS) illustrated the end of the bubble in tech and growth stocks, a structural change in the stock market. A decline from the peak in 2021 indicates a trend favoring value stocks (see Chart IV).
Chart IV
Small-Cap Growth Continues to Break Trends and Underperform Value
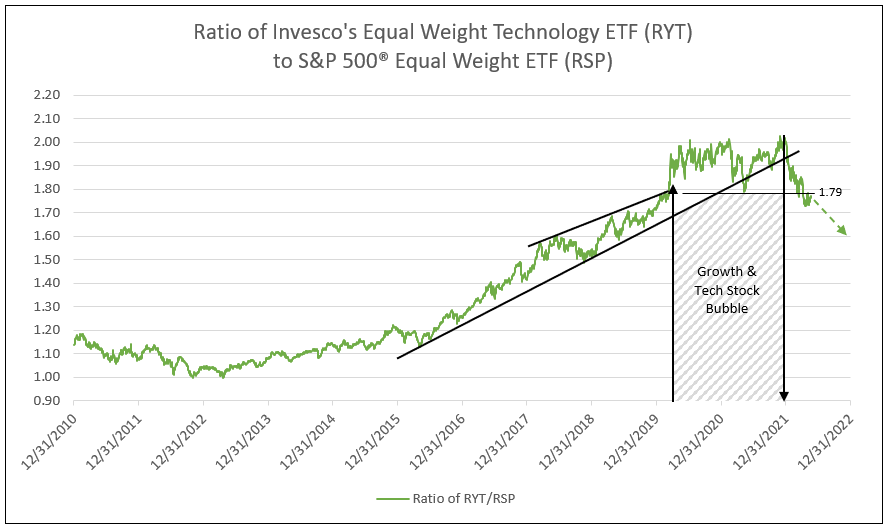
Following the peak in late 2021, Equal Weight Technology ETF (RYT) fell relative to Equal Weight S&P 500 ETF (RSP), declining below the low in early 2021, and indicating a trend favoring value stocks (see Chart V).
Chart V
In an Environment of Higher Yields Equal Weight Technology Underperforms Value
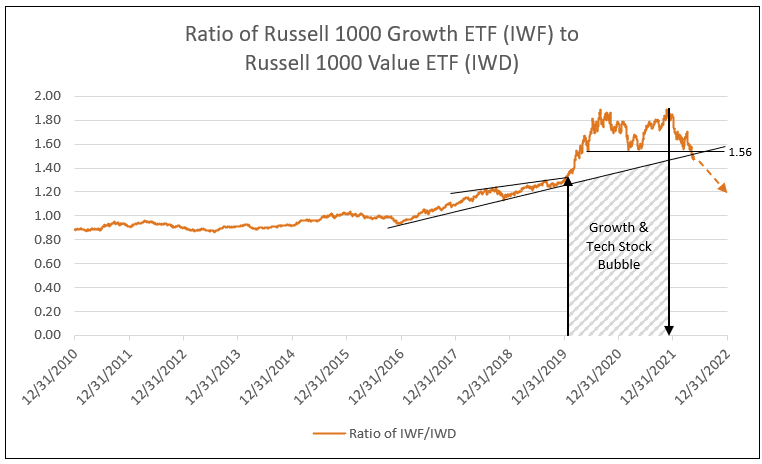
The decision point between the Large Cap Russell 1000 Growth ETF (IWF) compared to the Value ETF (IWD) arrived in late 2021. The peak in the ratio at the end of 2021 indicates a major structural change in large cap stocks, favoring value (see Chart VI). A further decline in the ratio of IWF/IWD to 1.20 is forecast later in 2022, given the strong economy for the second half of the year and the superior performance of bank stocks.
Chart VI
Decision Point: A Decline Below 1.56 in 2022 Indicates Major Institutions Favor Value Over Growth Stocks
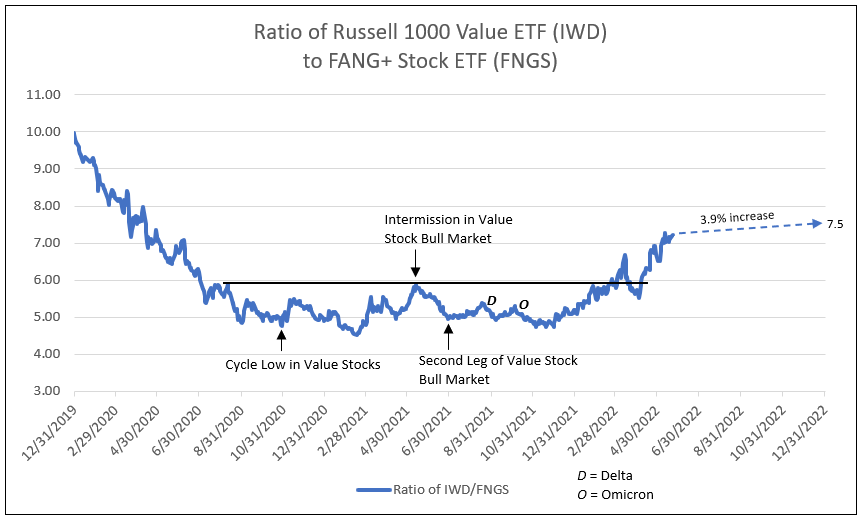
The Russell 1000 Value ETF dramatically outperformed FANG+ stocks, reaching new cycle highs since the fourth quarter of 2021. Following a correction in March 2022, the ratio of IWD to FNGS continues to recover, reaching new highs as value stocks outperform (see Chart VII).
Chart VII
The Ratio of Russell 1000 Value ETF to FANG+ Stocks Reaches New High in May 2022
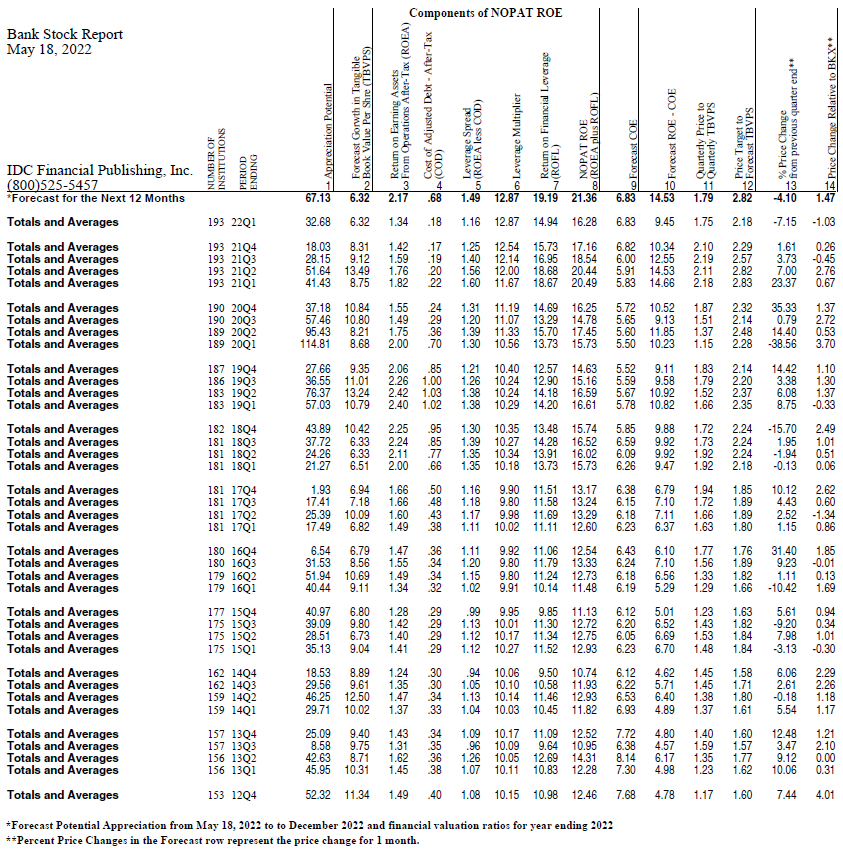
Bank stocks continue to build fundamentals for accelerating EPS growth, as return on equity is forecast to increase over the 21% mark in 2022 and 2023. In the current environment of a dramatic rise in the Fed funds rate to 2.5% in 2022 or early 2023, with an associated reduction in the Fed’s balance sheet, bank operating returns (ROEA) rise faster than the cost of financing (COD). Combined with increasing leverage, the result is a continued secular rise in ROE to new highs and, therefore, growth in TBVPS and accelerating EPS growth (see Table II).
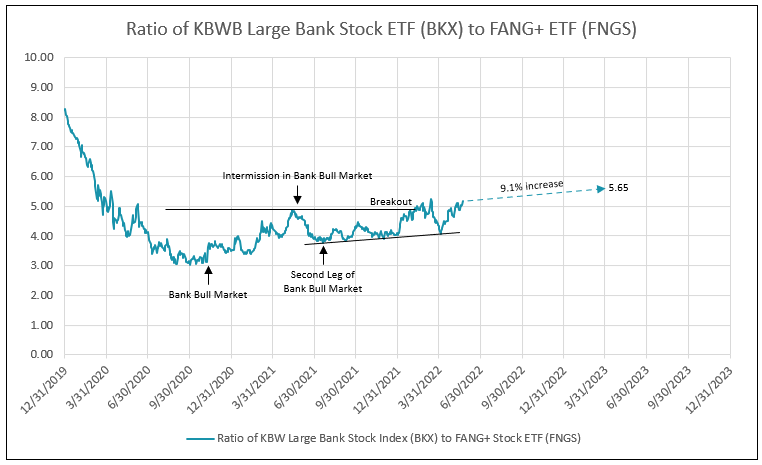
Impact from the war in Ukraine, higher inflation in the non-core categories food and energy, and potential recession fears, depress bank stocks relative to the Russell 1000 Value ETF (see Chart VIII). A realization that inflation has peaked, witnessing a declining impact from the conflict between Russia and Ukraine, and the outlook for continued economic expansion, together, propels bank stocks relative to other value stocks (and especially FANG+ growth stocks) in the coming months.
Bank Stocks Recover in May 2022
Chart VIII
The bank forecast for 21.4% ROE and 6.8% COE provides a forecast ROE less COE of 14.5%, which in turn projects a forecast target price-to-forecast TBVPS of 2.8. Given an 6.3% forecast increase in TBVPS and a 57.5% change from the current price to TBVPS (Table II, Column 11) to the price target to forecast TBVPS (Table II, Column 12), there is a forecast of 67.1% in potential price appreciation.
Table II
1 FSInsight, a Fundstrat Company
Let IDC provide you the value and financial history of your favorite bank stock. For you to better understand our process of valuation, we offer a free, one-time analysis of one of the 202 banks in our bank analysis database. Simply send your request with the bank stock symbol to info@idcfp.com.
To inquire about IDC’s valuation products and services, please contact jer@idcfp.com or info@idcfp.com or call 262-844-8357.
John E Rickmeier, CFA
President
Robin Rickmeier
Marketing Director