The History of HYG Lows Forecasting Lows in the S&P 500 and Bank and Value Stocks
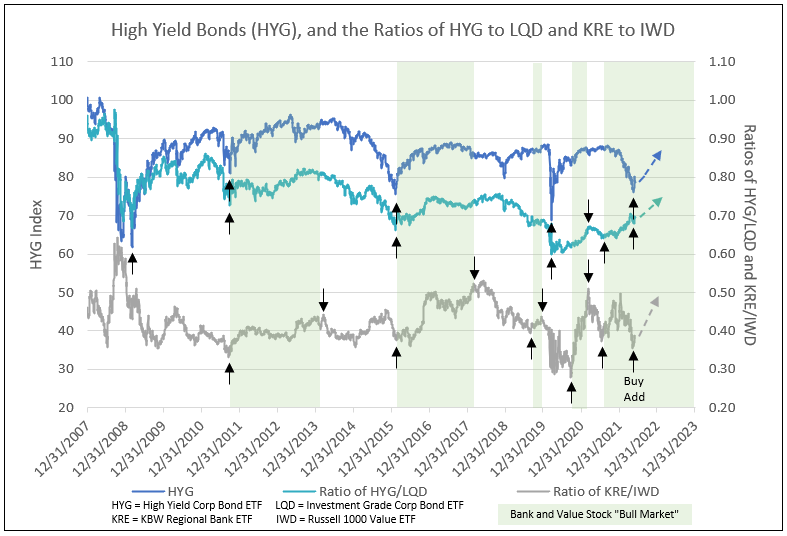
Cycle Low in the High Yield Bond ETF (HYG) Forecasts Cycle Low in S&P 500 and the Ratio of Regional Bank Stock ETF (KRE) to Russell 1000 Value ETF (IWD)
Every cycle low in the HYG forecast a low in the S&P 500 (see Chart I). The question everyone asks, “If the May 20 cycle low is final or could a new low occur in 2022?”
Chart I

Lows in HYG and the ratio of HYG to LQD forecasts value and, especially, bank stock bull markets (see Chart II). In periods of rising HYG relative to LQD or High Yield compared to Investment Grade Corporate Bond ETFs, value outperformed growth and the Bank Stock ETF (KRE) outperformed the Russell 1000 Value ETF (IWD).
Chart II
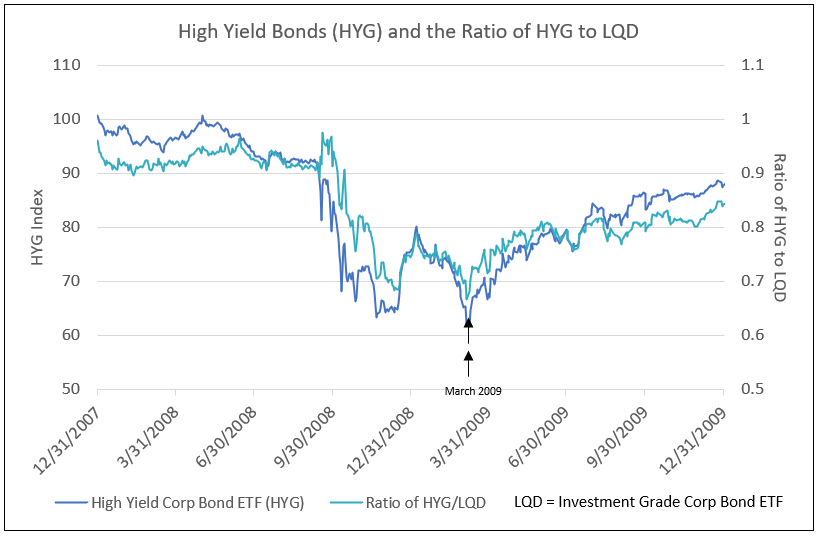
The decline in HYG (representing a rising yield on High Yield Corp Bonds) lagged the fall in the ratio of HYG to LQD (Investment Grade Corp Bonds) with a U-shaped formation. Not until March 2009 did the HYG and ratio form a V-bottom and coincided with the final low in the S&P 500 (see Chart III).
Chart III
Lesser cycle lows proceeded and followed the cycle low in October 2011 in the HYG and the ratio of HYG to LQD. The S&P 500 cycle low in October 2011 was part of a broad base low in the third quarter 2011 (see Chart I).
The cycle low in HYG and the ratio of HYG to LQD corresponded to the low in the ratio of KRE, Regional Bank ETF, to IWD, Value Stock ETF. The rise in HYG to 92 in March 2012 and the ratio of HYG to LQD to almost 0.8 allowed KRE to outperform IWD from October 2011 to March 2012 (see Chart IV).
Chart IV

The cycle low in HYG in February 2016 forecast the cycle low in the S&P 500. The trend in the ratio of HYG to LQD failed to increase and drifted lower to June 2016. The subsequent increase of the ratio favored value and, especially, bank stocks (see Chart V).
Chart V

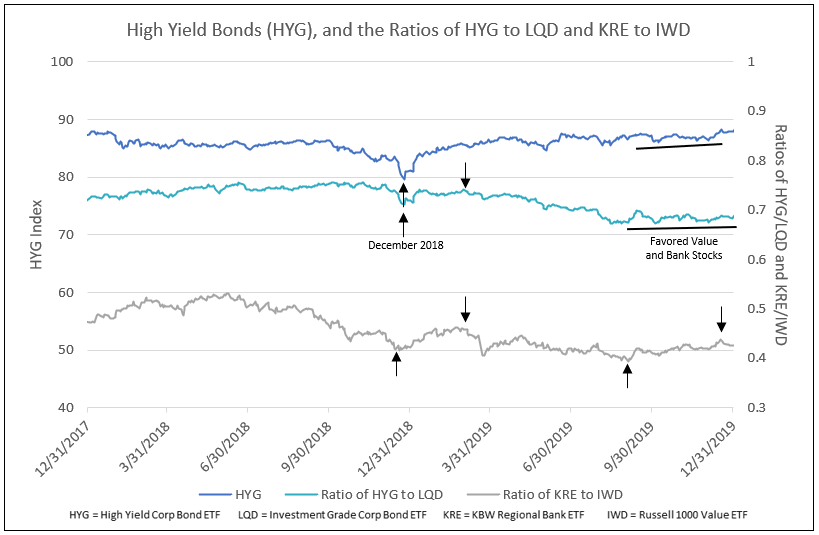
A stepped rise in HYG and the ratio of HYG to LQD followed the cycle low in HYG in December 2018. This low provided a 9-month outperformance of bank stocks (as seen in the ratio of KRE to IWD).
After the initial improvement and rise in HYG, it stalled and the ratio of HYG to LQD declined to August 2019. This decline favored growth stocks. The recovery in the ratio from August to December 2019 favored value and, especially, bank stocks (see Chart VI).
Chart VI
The cycle low in March 2020 coincided with the low in the S&P 500, both with a V-formation. The ratio of HYG to LQD initially recovered, but then drifted sideways favoring growth stocks. From October 2020 to March 2021, the rise in HYG and the ratio of HYG to LQD favored value and, especially, bank stocks (see Chart VII).
Chart VII

The initial recovery in HYG with a low on May 18 forecast the low in the S&P 500 on May 20. Like December 2018, as the stock market priced a change in Fed policy, the recovery in HYG and the ratio of HYG to LQD look to be in a step recovery with temporary pauses in the V-shaped formation. The trend in the ratio of HYG to LQD has risen from a low in July 2021 to early April 2022, only to decline for the remainder of April and in May due to recession fears. The continued rising trend in the ratio above 0.70 favors value and, especially, bank stocks (see Chart VIII).
Chart VIII
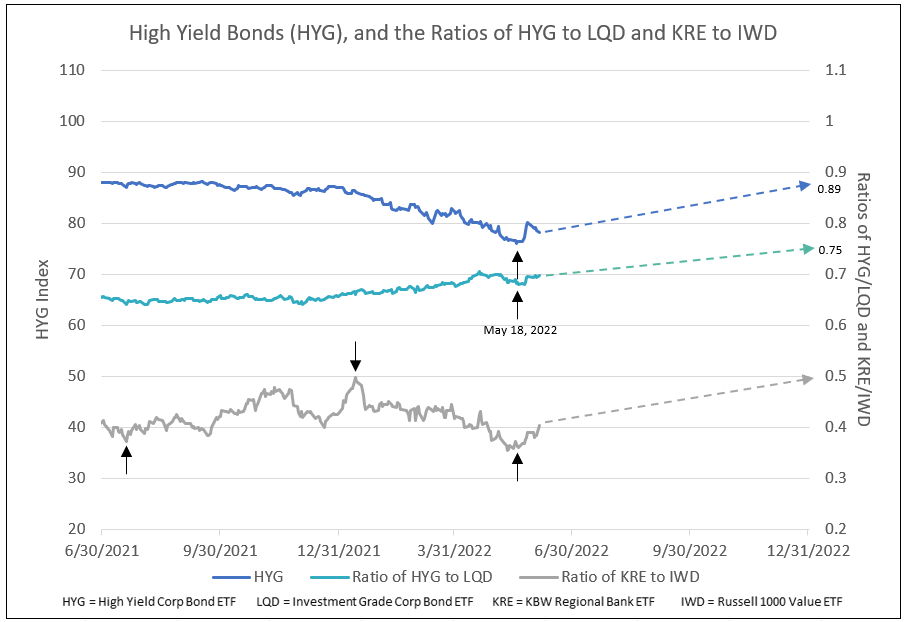
The overriding question remains, “Was the May 18 low the final low or are more cycle lows to follow, similar to 2011?” In 2011, following the first low in HYG, regional bank stocks declined relative to the Russell 1000 Value stocks (KRE/IWD) until October of that year. The final HYG low in October corresponded to the final low in the S&P 500 and KRE/IWD (see Chart IV). In May & June 2022, the cycle low on May 18 in HYG proceeded the S&P 500 low on May 20 and, subsequently, bank stocks relative to value (KRE/IWD) rose above 0.40%, confirming the S&P 500 low on May 20 (See Chart VIII).
Another confirmation of the May 20 low is the peak and decline in the University of Michigan’s Inflation Expectations (Thanks to Tom Lee of FundStrat). The year over year percent change in the Cass Freight Shipments Index from 35% in 2021 to zero today, plotted 6 months forward, forecasts the U of M Inflation Expectations to decline from over 5% in May to 3.5% by year-end 2022. This forecast is similar to the Cass Freight 6-month ahead projection in 2011 (see Chart IX).
Chart IX

Continued strength in the economy with strong employment, or no recession, combined with declines in food and energy prices, followed by a drop in core PCE inflation below 4%, together, support continued declines in implied inflation and softens the Fed’s hawkish tone, indicating the May 18 low was the final low for this cycle.
Let IDC provide you the value and financial history of your favorite bank stock. For you to better understand our process of valuation, we offer a free, one-time analysis of one of the 202 banks in our bank analysis database. Simply send your request with the bank stock symbol to info@idcfp.com.
To inquire about IDC’s valuation products and services, please contact jer@idcfp.com or info@idcfp.com or call 262-844-8357.
John E Rickmeier, CFA
President
Robin Rickmeier
Marketing Director