Supply Chains Improve and Potential for Decline in Energy Prices
The Consumer Price Index (CPI) is backward-looking pricing inflation for events that occurred earlier in the year or even 2021. As an example, housing inflation is priced in rental costs based on historical housing prices, but U.S. mortgage applications in June fell to the lowest level in 22 years (indicating declining housing prices in the future). Our attempt is to find leading indicators of inflation to assist in forecasting the peak and decline in CPI.
Supply Chains Improve
Consumer spending in the U.S. has been shifting back from goods to discretionary services. We have seen the demand for goods fall from the spike in March and April 2021, as spending on services (such as healthcare, travel, and entertainment) has surged. This trend back to services has also started to show up in the world of container shipping.1
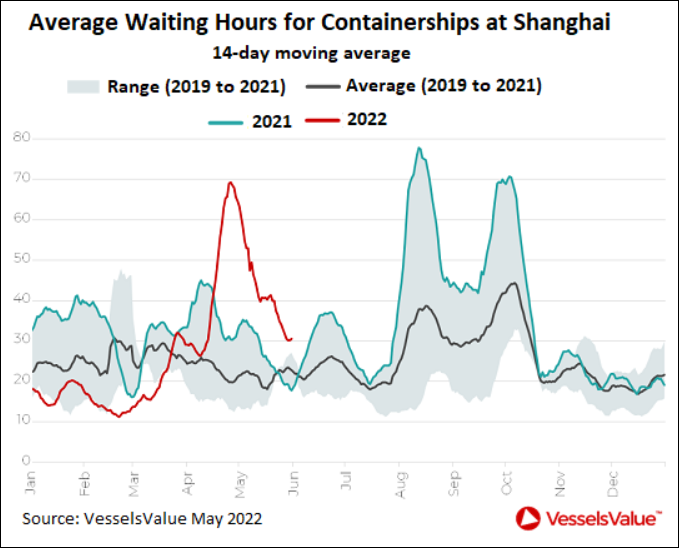
“Average waiting times for container ships at Shanghai, after having spiked to nearly 70 hours in April (14-day moving average), amid the lockdowns that snarled port operations in Shanghai, have now declined to 31 hours, according to VesselsValue.”1
While this data is still the longest wait time for this time of the year, (about 4 hours longer than the top of the range for the same period in 2019 through 2021), it is a big improvement. Average waiting hours for container ships reached nearly 80 hours in August 2021 (see Chart I).1
Chart I
Ocean freight rates to ship containers have also declined globally from the spike in September 2021. The Drewry World Container Index has dropped from the September 2021 high of $10,377 per 40-ft container, to $7,625 as of the week ended June 2, or by 26%.1
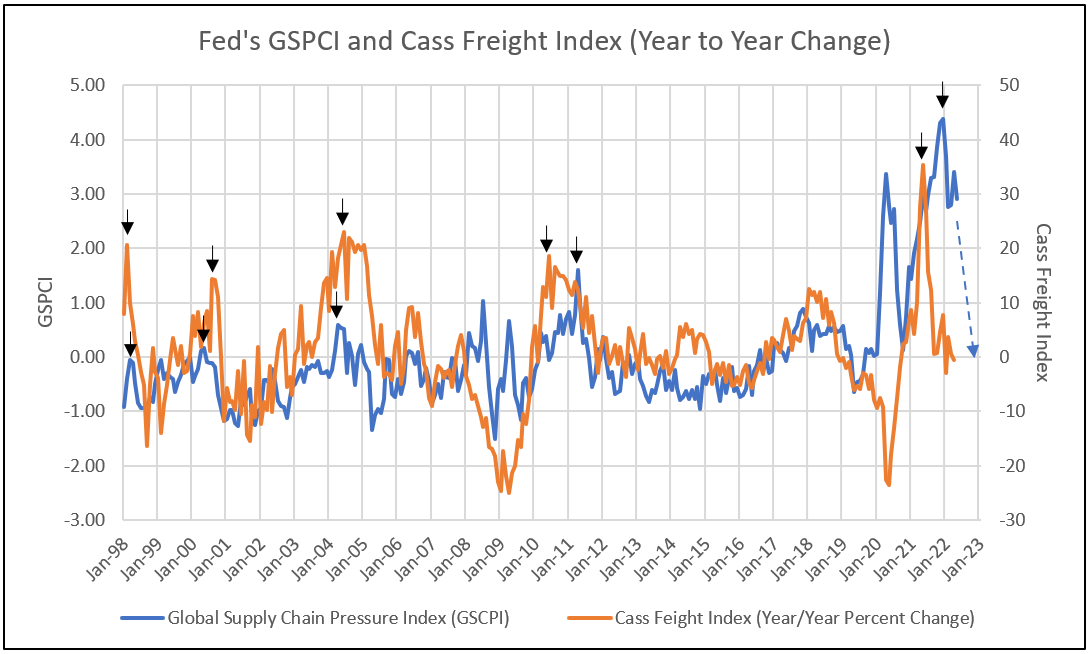
In response to the supply chain crisis, the New York Fed has developed the Global Supply Chain Pressure Index (GSCPI). This new index is based on data from global transportation costs and the supply chain-related components of Purchasing Managers’ Indexes (PMIs) from manufacturers in the US, China, the Eurozone, Japan, South Korea, Taiwan, and the UK.1
“The GSCPI integrates a number of commonly used metrics with the aim of providing a comprehensive summary of potential supply chain disruptions. Global transportation costs are measured by employing data from the Baltic Dry Index (BDI) and the Harpex index, as well as airfreight cost indices from the U.S. Bureau of Labor Statistics. The GSCPI also uses several supply chain-related components from Purchasing Managers’ Index (PMI) surveys, focusing on manufacturing firms across seven interconnected economies: China, the euro area, Japan, South Korea, Taiwan, the United Kingdom, and the United States.”2
The GSCPI are standard deviations from the average, and over time move to zero or average. The percent year-to-year change in the Cass Freight Index leads the SD of GSPCI by 8 months, forecasting zero in 2022 for GSPCI, similar to 2010/2011 (see Chart II).
Ben Bernanke, former Fed Chairman, said in recent interviews, the Fed could pull off a soft landing as long as supply-side inflation continues to improve.3
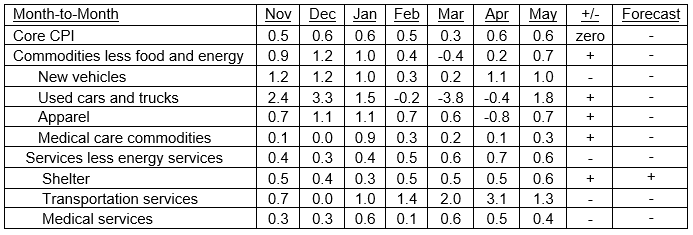
While nearly 2% of the CPI for May came from categories with known supply chain constraints, June to August contributions to core inflation are expected to significantly decline.3
- Used Cars +0.6%
- New Cars +0.5%
- Furnishings +0.5%
- Apparel +0.2%
In addition to the Cass Freight Index decline forecasting a dramatic slowdown in global supply chain constraints, the Manheim used car index leads CPI used car prices by 2 months, forecasting further declines.3
- May CPI reflects March improvements in Manheim.
- June and July CPI used car prices could decline another 0.56 following the 0.64 drop in May.
Chart II
Crude Oil: Potential for Peak and Decline In Price
The first break in oil prices was a result of the collapse of Canadian heavy crude prices as European war upended global market plans, making Canada’s crude oil sands less valuable.
Western Canadian Select’s discount to benchmark WTI widened from $12 in April to $20.80 on June 3, the widest it has been in 7 months. Oil sands competes with releases from the U.S. strategic petroleum reserve and are all nearly similar in grade. Historically, a discount of greater than $20 indicated future weakness in WTI crude prices.
At the same time, India and China are buying up Russian oil while much of the world is avoiding doing business with the country. Russian oil is available for as much as $40 under Brent price, according to trading sources. A glut of ultra-light oil is also contributing to the collapse on the supply side of the equation.
Ed Morse, the commodity strategist at Citi, indicated in early June that product demand fell from an estimated 3.6% increase to a 2.2% increase for the next 12 months. This forecast by Citi is not the lowest or highest among oil analysts and strategists. One area in particular that is weak is petrochemical demand, which earlier in the year was projected to be much stronger.
Given the cost structure of the oil industry, increased supply and weakening demand, Morse projects year-end crude oil prices in the $70 per barrel range, versus the market’s expectation of $120.
Inputs to Global Inflation Are Easing, Creating Price Relief
Three of the key supply-side factors driving today’s global inflation levels have already turned around, meaning relief could be on the horizon for shoppers worldwide.4
These inputs to global inflation have reached recent peaks and are declining:
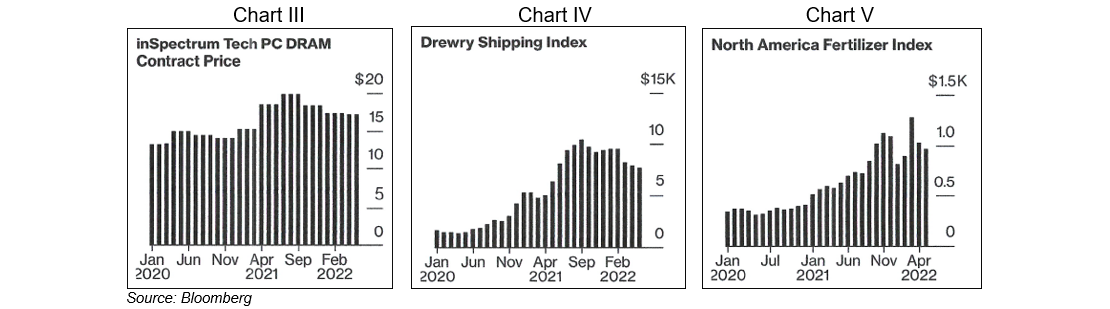
“A bellwether semiconductor price – a barometer of costs of finished electronics products as diverse as laptops, dishwashers, LED bulbs, and medical devices delivered worldwide – is now half of its July 2018 peak and down 14% from the middle of last year.” 4
The spot rate for shipping containers tells us more about expenses we can expect later in the pipeline for apparel, luxury items or home furnishings. The rate has declined 26% since its September 2021 all-time high.4 For a more comprehensive picture of supply distributions, see the NY Fed’s GSPCI in Chart II.
North America’s fertilizer price is an indicator of global food inflation and is 34% below peak.
With inflation now exceeding 8% in the euro area and the U.S., central bankers around the world are scrambling to contain it.4
Table II
Percent Change in Core CPI for All Urban Consumers
Atlanta Fed’s Sticky Price CPI
The Atlanta Fed’s sticky-price index (CPI) – a weighted basket of items that change price relatively slowly – increased 7.5% (on an annualized basis) in May, following a 7.1% increase in April. On a year-over-year basis, the series is up 5.2%.5
On a core basis (excluding food and energy), the sticky-price index increased 7.3% (annualized) in May, and its 12-month percent change was 5.0%.5
The flexible cut of the CPI – a weighted basket of items that change price relatively frequently – increased 27.9% (annualized) in May and is up 18.5% on a year-over-year basis.5
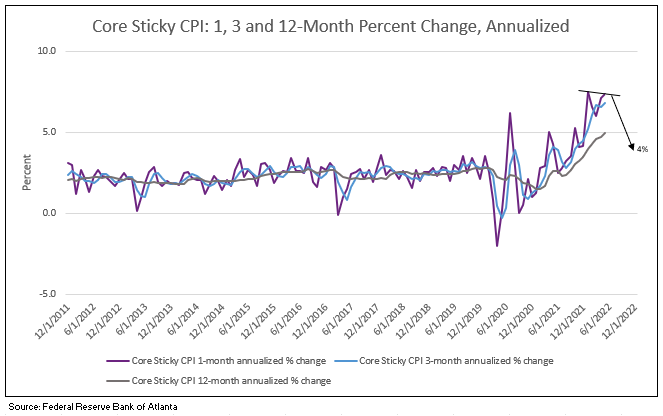
Core Sticky CPI one-month rate of change reached peak 2021 levels in May 2022 at 7.5%. Sticky CPI is expected to recede to the 4% level by year-end or early 2023 (see Chart VI).
Chart VI
Core Sticky CPI
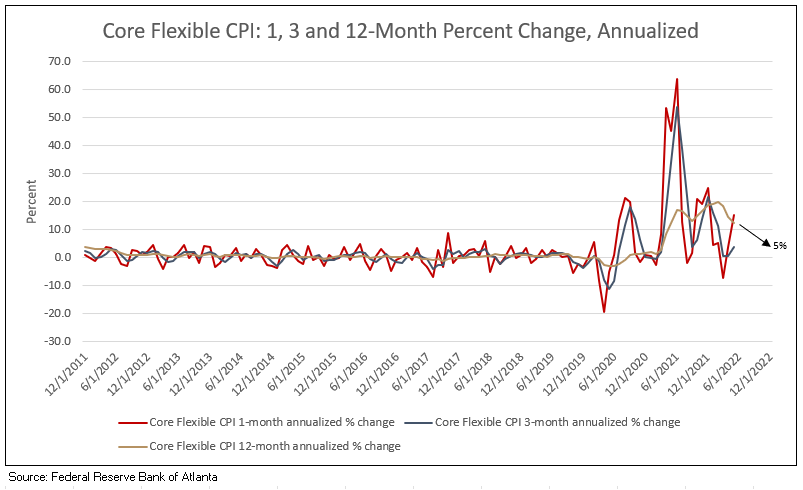
Core Flexible CPI had upward pressure from the rebound in 1-month annualized flexible CPI rebounding to over 10%. Flexible CPI is expected to recede to 5% by year-end or early 2023 (see Chart VII).
Chart VII
Core Flexible CPI
1 Wolf Street, June 6, 2022
2 Global Supply Chain Pressure Index (GSCPI) Overview, New York Fed
3 Fundstrat, June 13, 2022.
4 Inflation is Poised to Ease According to These Three Indicators
5 The Atlanta Fed, Sticky-Price CPI
Let IDC provide you the value and financial history of your favorite bank stock. For you to better understand our process of valuation, we offer a free, one-time analysis of one of the 202 banks in our bank analysis database. Simply send your request with the bank stock symbol to info@idcfp.com.
To inquire about IDC’s valuation products and services, please contact jer@idcfp.com or info@idcfp.com or call 262-844-8357.
John E Rickmeier, CFA
President
Robin Rickmeier
Marketing Director