The Remarkable Correlation Between Inflation and Banks Stocks
The Changing Characteristics of Inflation
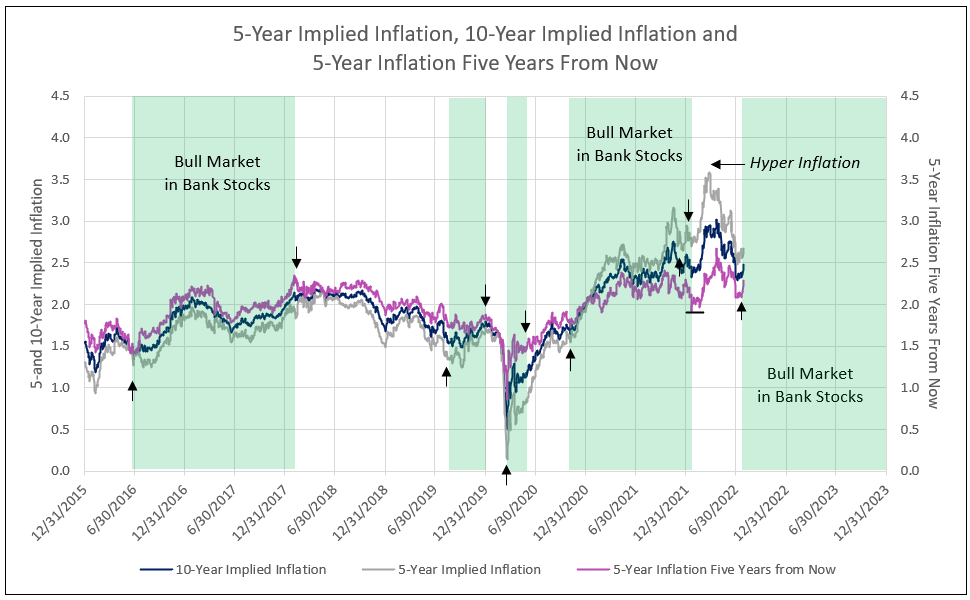
From 2015 to 2020, 5-year-ahead inflation was defined as 5-year implied inflation less 10-year implied inflation, or 5-year inflation five years ahead of current inflation. When 5-year-ahead inflation is less than 5 or 10-year implied inflation, it indicates a deflation formation, as future inflation expectations are below shorter-term expected inflation. Bank stocks outperformed, however, as long as 5 and 10-year implied inflation increased, which occurred from June 2016 to February 2018 and August 2019 to November 2019 (see Charts I and II).
Beginning in September 2020, inflation expectations 5-years-ahead rose and, in 2021, exceeded 5 and 10-year implied inflation, indicating an inflationary formation. The Fed prefers 5-year-ahead inflation expectations to be high shorter-term, but below the absolute value of 2.5%. Spikes above 2.5% in 5-year-ahead inflation, caused by 5-year implied inflation over 3%, requires the Federal Reserve to be more aggressive with 75 basis point increases in the Fed funds rate (see Chart I).
Chart I
Not Too Hot and Not Too Cold
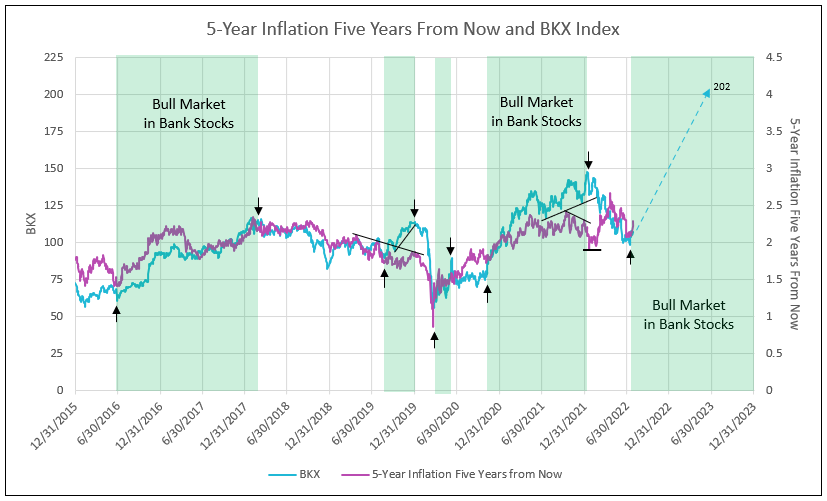
IDC Financial Publishing (IDCFP) examines the correlation of the bank stock index of large banks (BKX) when plotted with the 5-year inflation five years ahead. This inflation measure equals the 5-year implied inflation (U.S. 5-year yield less 5-year TIPS) less 10-year implied inflation, and the difference is then subtracted from the 10-year implied inflation, allowing a measure of inflation from the 5th to 10th year.
Since 2015, the 5-year-ahead inflation was highly correlated to bank stocks (see Chart II). The price of bank stocks (BKX) rose from levels on Chart II below the inflation rate in June 2016 to equal to the rate in early 2018, as inflation increased and provided a bank stock bull market. Conversely, a decline in the 5-year-ahead inflation rate from February 2018 to August 2019 forecast risk to bank stocks. However, from August to December 2019, the recovery in bank stocks paralleled the marginally higher inflation. Inflation expectations, however, remained under 2% while the BKX rose to a new high of 120, creating a sell signal in bank stocks at year-end 2019.
Beginning in late 2020, there was a sharp upward move in implied inflation 5-years-ahead, going from 1.7% to 2.36% by May 2021. and the BKX recovered from 71 to 134 from September 2020 to May 2021. This implied inflation rate leveled off in the range of 2.0% to 2.4% beginning June 2021 and through the remainder of that year. The BKX rose to its peak of 147.56 by early 2022, an advance of 107.8% for the bank bull market period from September 21, 2020, to January 13, 2023.
Due to lack of understanding the impact of 5-year-ahead implied inflation on banks stocks until recently, IDCFP missed the bank stock sell signal in January 2022. Implied inflation peaked at 2.41% on October 15, 2021, and declined 1.92% on January 20, 2022, while the BKX rose to a new high of 147.56 on January 13, 2022. The disparity seen in Chart II in early 2022 indicated a sell in banks stocks similar to December 2019.
Chart II
The Future of Inflation and Bank Stocks
Bank stock performance relative to value stocks parallels the trends in 5-year-ahead implied inflation. From June 2016 to February 2018, banks stocks (BKX) outperformed value stocks (IWD) as 5-year-ahead implied inflation rose from 1.45% to 2.25%. From February 2018 to August 2019, 5-year-ahead inflation declined as Trump tariffs on China and Europe forced Germany and the EU to reduce interest rates to major negative levels. The low and sudden reversal in U.S. yields from August to December 2019 allowed this inflation to increase and bank stocks outperformed value in the last four months of 2019.
Following the shock of COVID, 5-year-ahead implied inflation accelerated above 2% in late 2020, resulting in another period of bank stock outperformance relative to value, and lasted until January 13, 2022. However, beginning in the fourth quarter of 2021, this inflation, on trend, began to decline and then fell sharply in January. At the same time, bank stocks (BKX) rose to a new high on January 13, 2022, and outperformed value stocks -- a sell signal for bank stocks (see Chart III).
Chart III
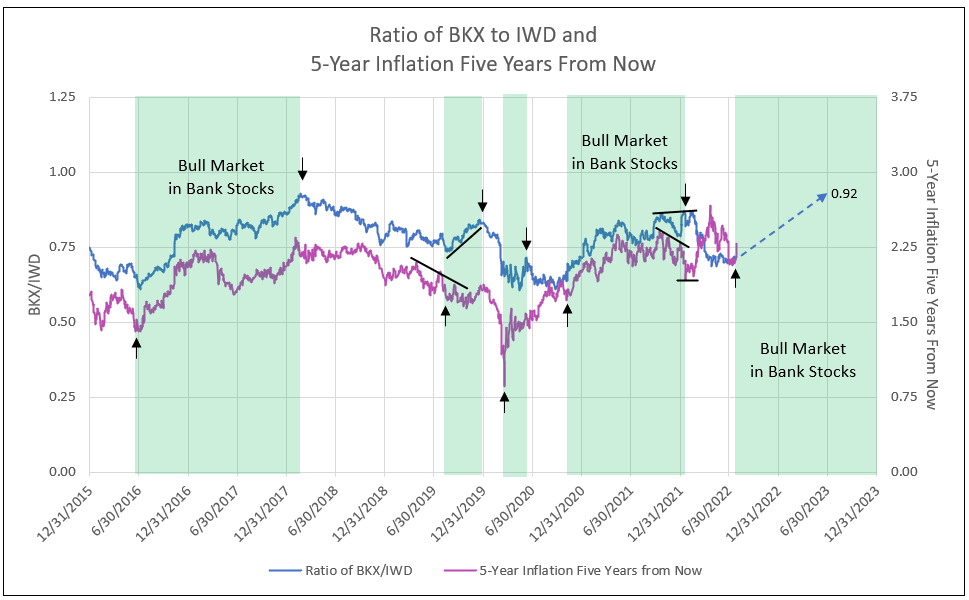
From January to July 2022, bank stocks (BKX) corrected from 149.56 to 98.36, or a decline of 34.2%. Five year-ahead implied inflation fell to 2.08%, setting the stage for a recovery toward 2.5%. With the two measures again aligned, a new bull market in bank stocks has reemerged.
Bank stocks in bull markets were up 71% from June 2016 to January 2018, and 108% from September 2020 to January 2022, which supports the forecast of an 89% advance from 107 in July 2022 to 202 by mid-year 2023 (see Chart II).
The Federal Reserve seems to be in control, given 5-year-ahead implied inflation is above 2%, but less than 2.5%. When it declines below 2% or rises above 2.5%, the Fed takes action to limit deflation (too cold) or stop inflation (too hot).
Let IDC provide you the value and financial history of your favorite bank stock. For you to better understand our process of valuation, we offer a free, one-time analysis of one of the 202 banks in our bank analysis database. Simply send your request with the bank stock symbol to info@idcfp.com.
To inquire about IDC’s valuation products and services, please contact jer@idcfp.com or info@idcfp.com or call 262-844-8357.
John E Rickmeier, CFA
President
jer@idcfp.com
Robin Rickmeier
Marketing Director