Inflation Peaked and Moderates for the Rest of 2022
The consumer price index for July 2022 increased 8.5%, lower than the 9.1% annual gain in June. Month-to-month CPI change was zero. The peak and decline in oil prices and drop in gasoline prices in July drove half of the monthly decreases.
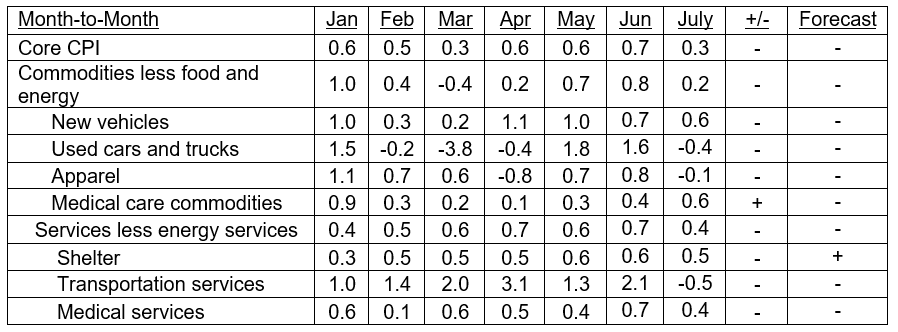
Excluding volatile food and energy components, core CPI increased 0.3% in July from a month earlier but was less than the 0.7% increase in June. Commodities less food and energy rose 0.2% versus the June increase of 0.8%, mostly due to the decline in used cars and trucks and new vehicle prices, as well as declines in apparel and transportation services. Only the service sector rose month-to-month, but shelter prices narrowed to a 0.5% increase (see Table II).
One-Month Change in Flexible CPI Peaked in the Summer of 2021 and Fell 11.3% in July at Annual Rate
Chart I
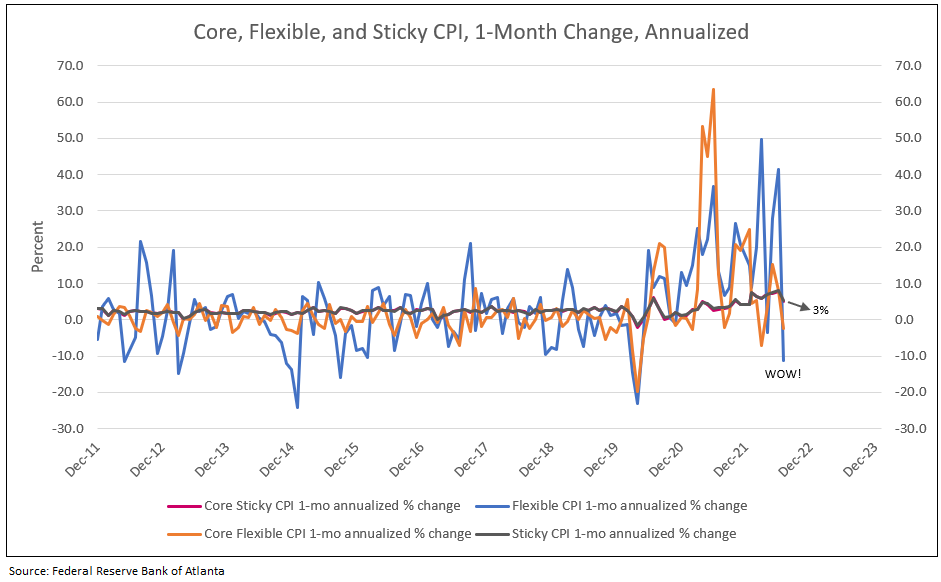
The Atlanta Fed’s sticky price consumer price index (CPI), a weighted basket of items that change relatively slowly, increased 5.4% on an annual basis in July, following an 8.1% increase in June. On a year-over-year basis, the series is up 5.8%.
On a core basis, excluding food and energy, the sticky price index increased 5.2% (annualized) in July and its 12-month percent change was 5.6%. Those that believe in future continued higher inflation rates see sticky inflation remaining above 5%, while the camp that believes inflation has peaked see sticky inflation falling to 4% by year-end 2022 and to 3% in 2023.
The driver to moderating sticky inflation is the flexible cut of CPI, a weighted basket of items that change relatively frequently. Flexible CPI fell 11.3% (annualized) in July compared to an increase of 16.3% on a year-over-year basis. Month-to-month core flexible CPI was down 1.5% in July compared to core sticky CPI, which was up 5.2%, both at annual rates.
The Federal Reserve is of the view that the current inflation is too high but should normalize over time. Core PCE and sticky CPI are expected to recede to 3.5% to 4.0% by late 2022 and decline to 3% in 2023 (see Chart I and Table I).
Reasons for Inflation to Moderate for the Remainder of 2022
1. Decline in commodity prices led by gasoline declining to under $4 a gallon in the fall and then $3.50 by year-end (see Chart I and Table II).
2. Decrease in inflation swaps and TIPS yields (see Nowcasting Table I and Chart III).
3. More favorable surveys of inflation and confidence from University of Michigan, New York Fed surveys and Small Business surveys (see Chart II).
4. Finally, month-to-month reported CPI, PCE and PPI data moderate to under 2% annualized for the remainder of 2022 (see Table II). July PPI was reported at -0.5%.
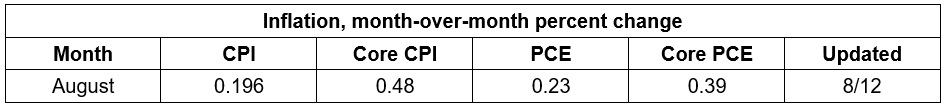
Nowcasting from the Cleveland Fed
Nowcasting from the Cleveland Fed for August dropped from an earlier estimate of 0.380 to 0.196 today. The decline reflects July gasoline which subtracted 0.41pp from July CPI and August gasoline subtracting 0.81pp, or 2 times the impact.1 CPI for August is expected to be at a 2.35% annual rate and PCE at 2.76%, moderating inflation.
Table I
Cass Freight Leads the Fed’s Global Supply Chain Pressure Index (GSPCI) Forecasting Deflation from the Supply Chain in 2023
The Cass Freight Index declined to zero nine months ago, forecasting a drop in GSPCI. By year-end 2022, the GSPCI is forecast to decline to -1.00 indicating deflation from the supply chain in 2023 (see Chart II).
Chart II
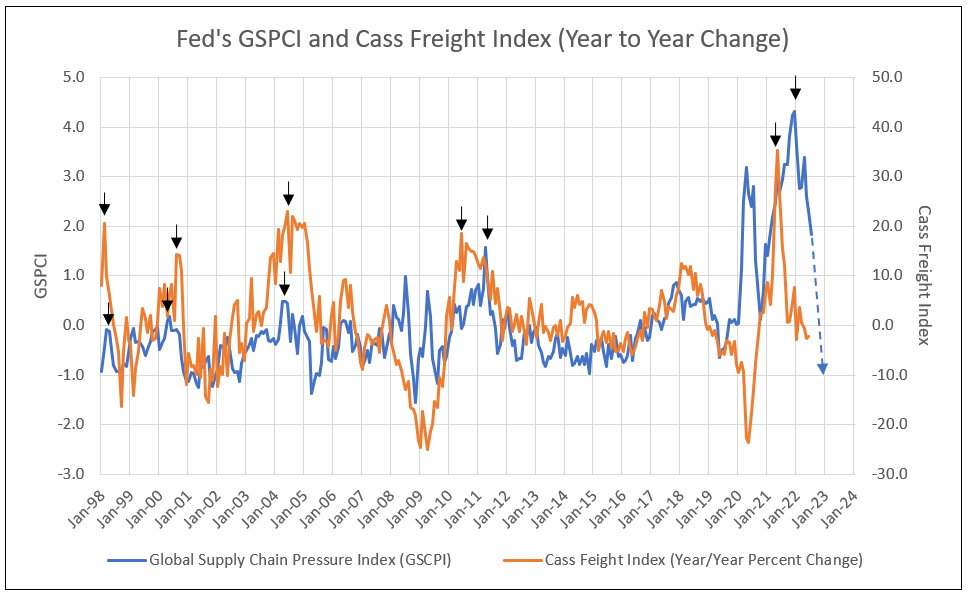
Table II
Percent Change in Core CPI for All Urban Consumers
Housing Continues to Be Strong Driver of Inflation
Rent and owners’ equivalent rent (OER)—the amount of rent equivalent to the cost of ownership—are among the most important components of the Consumer Price Index (CPI) and the personal consumption expenditures (PCE) price index.2
The Dallas Fed forecasting model shows that rent inflation and OER inflation are expected to increase materially in 2022 and 2023. Given their weights in the core PCE price index, rent and OER together will presumably contribute about 0.6 percentage points to 12-month core PCE inflation for 2022 and about 1.2 percentage points for 2023.2 Housing inflation in core CPI could average 5% in 2023.
These forecasts also suggest that rising inflation for rent and OER could maintain the overall and core PCI and PCE inflation rates above 2.0% in 2024, when current supply bottlenecks and labor shortages may have subsided.
Recovery in Productivity
The biggest driver of lower inflation is the decline in top line CPI below the 4.5% wage growth expected by year-end 2022 and the 4% forecast in 2023, creating real wage increases. Growth in real wages stimulates the economy, reversing the decline in productivity.
U.S. nonfarm worker productivity fell at a 4.6% annual dip in the second quarter, following a steep 7.4% rate of decline in the first quarter, the largest in 75 years. Workers put in more hours and produced less. Hours worked increased to a rate of 2.6% in the second quarter, down from an increase of 5.3% in the first quarter.
As worker real wages increase, so does consumption and productivity. A snap back in productivity reduces unit labor costs or future inflation.3
Barry Knapp of Ironsides Microeconomics said in an interview on CBNC on August 11, “GDP accounting is a mess. Using the income accounts and hours worked indicated positive GDP growth in the first half of 2022 and limited declines in productivity.”
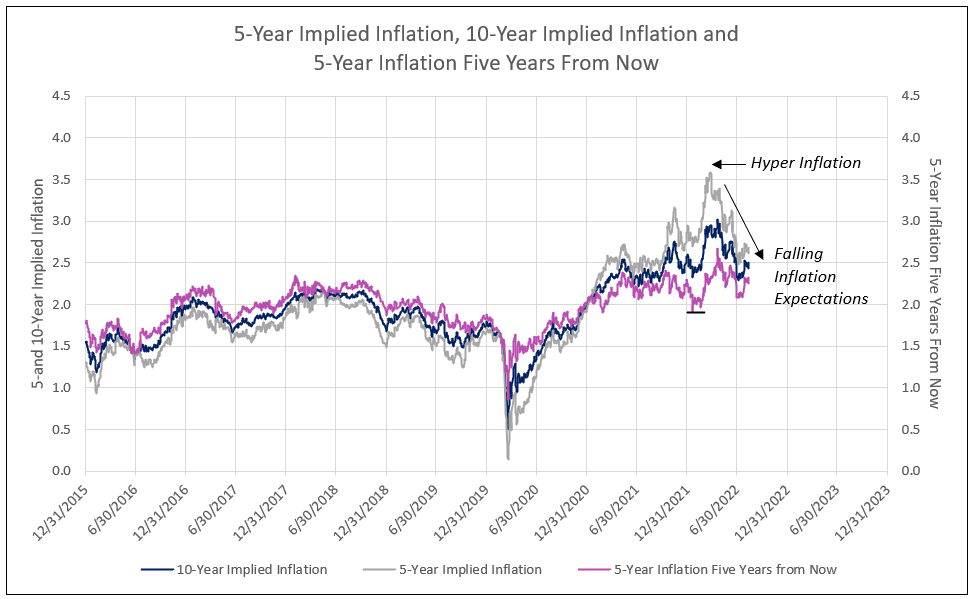
All Implied Inflation Readings Decline
Chart III
1 Fundstrat, August 12, 2022.
2 Surging House Prices Expected to Propel Rent Increases, Push Up Inflation
3 From an interview with Jeremy Siegel, Professor of Finance at Wharton.
To view all our products and services please visit our website www.idcfp.com. For more information about our ranks, or for a copy of this article, please contact us at 800-525-5457 or info@idcfp.com.
John E Rickmeier, CFA
President
jer@idcfp.com
Robin Rickmeier
Marketing Director