Inflation Dramatically Moderates in 2022 and Approaches 2% in 2023
Actions by the Federal Reserve
The Federal Reserve attempts to control inflation with actions through “open media campaigns” and the Open Market Committee, with increases in the Fed funds rate and reductions in the size of the Fed’s balance sheet (QT).
Since the Jackson Hole conference in August, the Fed governors used an open media campaign in speeches to convince the public of their intent to suppress inflation. In addition, the Fed speakers tried to put aside the notion of the Fed funds rate being neutral with limited upside hikes on the horizon.
The Facts and Forecasts
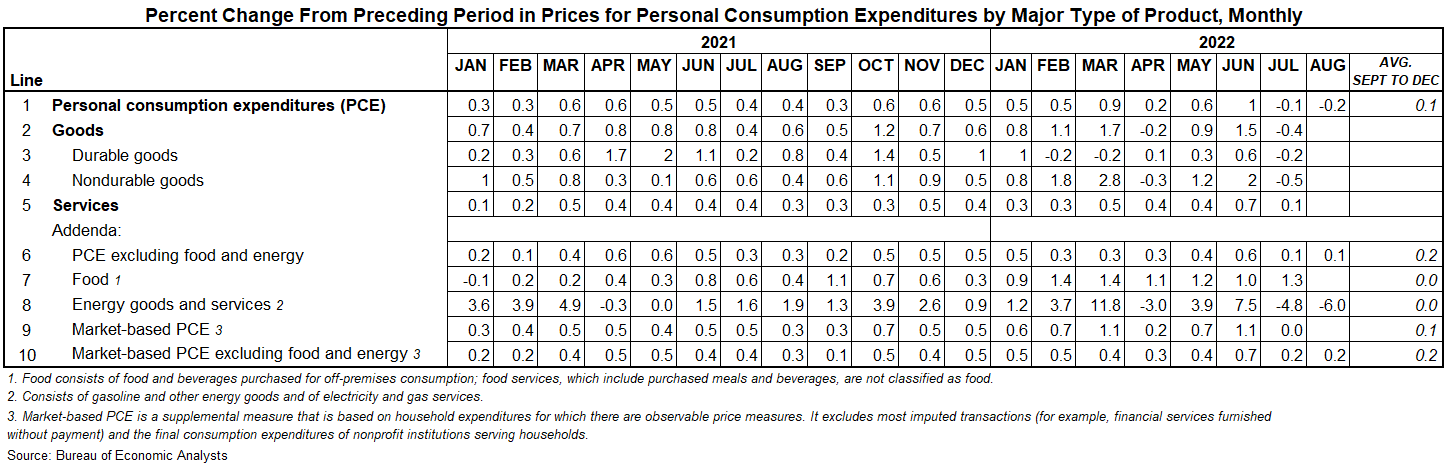
- The month-over-month percent changes in the prices of Personal Consumption expenditures declined for July, are estimated to further decline in August, and forecast to increase only 0.1% a month for the remainder of 2022.
- PCE, excluding food and energy, increased only a minimal 0.1% for July and estimated to do the same in August.
- The obvious contributor to the decline is energy, which fell 4.8% from June to July, and estimated to fall another 6.0% in August.
- Services make up 56% of CPI. Rent and owner equivalent rent (OER) which comprise 32% (7.2% and 23.5% respectively) of CPI increased 0.1% in PCE and rose 0.4% in CPI from June to July. As detailed later this article, the Housing Market Index (HMI), with a 24-month lead, forecasts a 3% annual rate for both rent and OER by 2023.
- Market-based PCE excluding food and energy, or core PCE without services, increased 0.2% in June and July. It is estimated to rise 0.2% in August and continue at that rate for rest of 2022.
- The August ISM Manufacturing Prices Paid Index fell to 52.5 from 55.3 a month earlier. Prices paid declined from a recent peak of 85, forecasting the Producers Price Index (PPI) to fall to near zero in August from a monthly rate of 15.5% in July.1
- The monthly percent change of U.S. average hourly earnings for all employees fell from 0.5 in July to 0.3 in August 2022, or a 3.6% annual rate. Real wage growth in the last half of 2022 appears to be a reasonable expectation as wages increase 0.3% a month, while core PCE rises 0.2% and CPI advances only 0.1%.
Table I
Core PCE, Excluding Food and Energy, Estimated at 2.4% Annual Rate for the Second Half of 2022
To quote Tom Lee, “key component of CPI and PCE are beginning to fall like a rock.” Some items are starting to fall, and some are forecast to decline sharply, while a few will fall significantly in the next year.
Table II
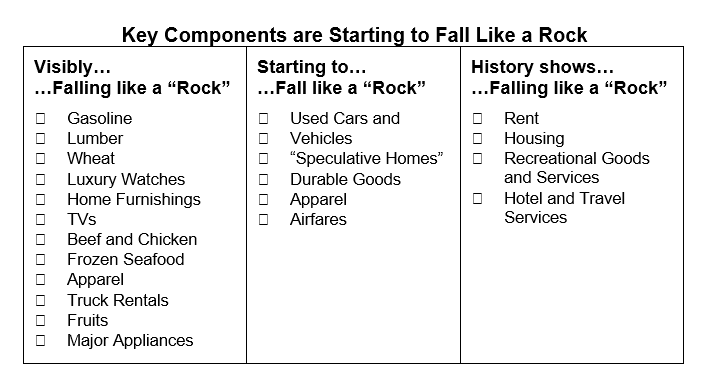
Table Source: Fundstrat
The Sticky Component of Rent
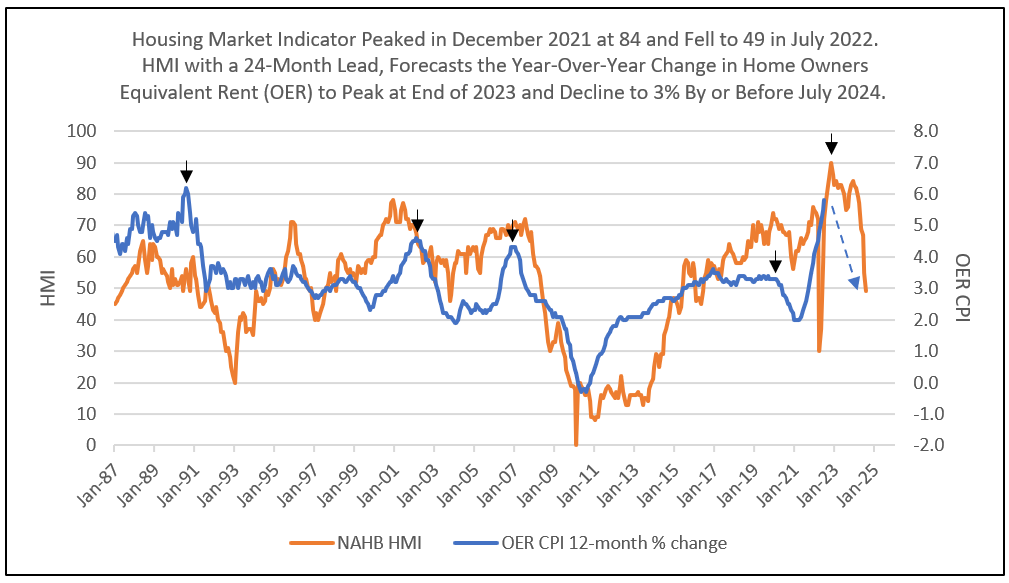
Rent component is measured by rent from primary residence (7.2% of CPI) and owners equivalent rent (OER, 23.5% of CPI) for a total of 32% of CPI, and a large portion of PCE. Rent and OER are best forecast by the NAHB/Wells Fargo Housing Market Index (HMI) with a 24-month lead time.
HMI is based on a monthly survey of NAHB members designed to take the pulse of the single-family housing market. The survey asks respondents to rate market conditions for sale of new homes at the present time and in the next six months, as well as the traffic of prospective buyers of new homes.
HMI peaked in December 2021 at 84 and fell to 49 in July 2022. With the 30-year mortgage rate increasing to 0.25%, a further decline in HMI us projected for August and September. Plotted 24 months forward, HMI forecasts year-over-year monthly change in rent and OER. As a result, the sharp declines in HMI forecast the significant decline in year-to-year percent change in both rent and OER. HMI plotted 24 months ahead forecasts 3% rent and OER inflation in late 2023 (see Table II, Charts I and II).
Chart I
Following the Lead of HMI, Rent Percent Change “Falls Like a Rock”

Chart II
Following a Decline in HMI, OER Percent Change “Falls Like a Rock”
The Federal Reserve has headquarters in D.C. and 12 regional banks, each with floors of economists and forecasters. HMI is only one of many leading indicators the Fed has developed to forecast each component of inflation. Reported inflation lags are also preceded by the bond market swaps and implied inflation (nominal minus real yields), and commodity prices, industry surveys and other leading industry indicators substantially lead reported CPI.
Further Declines in Gasoline are Expected to Lower Consumer Inflation Expectations
The Fed relies on the University of Michigan (UoM) inflation expectation one year forward. UoM shows that the price of gasoline is a huge influence on consumer expectations. Gas prices declining in August below $4.00, and even $3.50 in some states, could reduce UoM inflationary expectations from 4.8% in August to 3.5% in September.2
How much Reduction in Inflation is Sufficient to Meet the Fed’s Target?
The only inflation target we hear about from Fed speak to the media is to drive core PCE to 2%, yet the best measure of inflation remains levels implied by the bond market.
Implied inflation is a bond market measure.
- The 5-year T-Note yield less the 5-year inflation-indexed yield.
- The 10-year T-Note yield less the 10-year inflation-indexed yield.
- Five-year implied inflation 5-years-from-now (or 5-year minus 10-year implied inflation subtracted from the 10-year implied inflation rate, resulting in the implied inflation for the last 5 years of the next 10-year period.) Short-term implied inflation can also be measured over 1-, 2- or 3-year periods.
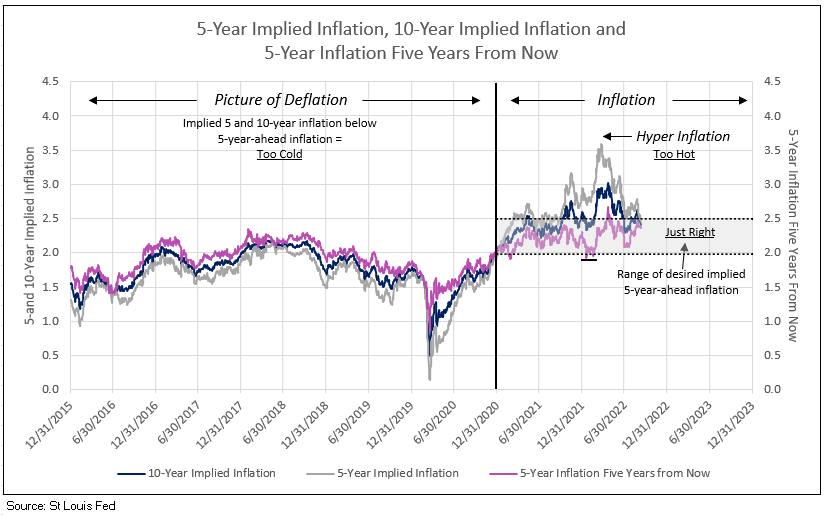
A picture of deflation.
Deflation is illustrated by measures of implied inflation, when the
10- and 5-year implied inflation rates are less than the 5-year rate
5-years in the future. Chart III illustrates the deflation that reigned
from 2015 to 2020. The 5-year rate 5-years ahead remained slightly above
and, at times, below 2%, while 5- and 10-year implied inflation
continuously fell below this 5-year-ahead rate. The Fed does not desire
this deflation outcome in the future.
A picture of controlled inflation.
Inflation is illustrated by 5- and 10-year implied inflation
continuously greater than the 5-year-ahead rate. Levels of the 5- and
10-year implied rates above 2.5% are excessive and require Fed action,
by both their media campaign and open market committee.
Implied inflation by all measures tumbled in the first half of 2022. Five and 10-year yields fell to 2.5% and the 5-year-ahead rate dropped to a little over 2%. Currently, 1-year implied inflation is at 1.7%, while 5-year is at 2.46%, 10-year is at 2.41%, and 5-years-ahead inflation rate is at 2.36%. Note the 5- and 10-year implied rates are always above the 5-year-ahead rate, a picture of inflation…and with rates less than 2.5%, a picture of controlled inflation.
While implied inflation measures were at the high end of the acceptable range, sharply falling inflationary components in 2022 are expected to reduce current implied inflation levels closer to 2% the remainder of 2022 and the year 2023 (see Chart III).
Chart III
Economist Who Called Inflation Surge Says Fed Should Go Slow Now
Dr. Jeremy Siegel, Emeritus Professor of Finance at the University of Pennsylvania’s Wharton School of Business said, “the Fed should not get overly aggressive right now,” Dr Siegel sees inflation peaking and falling sharply in particular areas. He indicated “the CPI and PCE, the way these gauges are constructed, lag what is actually happening in the real world.” He echoed the evidence we presented above, as well as the continuous forecast by Tom Lee of Fundstrat, J.P. Morgan strategists, Goldman Sachs economists, and many more.
Peak in Fed Funds Rate
The current Fed funds rate, as forecast by the futures market, peaks at 3.9% in March 2023 and declines to 3% by March 2024. Given the above outlined forecast of a dramatic decline in inflation in 2022 and levels reaching 2% area in 2023, the Fed funds rate peaks at 3.9% or less as the futures market realizes the degree of moderation in inflation.
The Fed took decisive action in the first eight months of 2022, reducing cash assets at commercial bank using reverse repurchase agreements to drain liquidity (see Chart IV).
Chart IV
Fed Action in First Eight Months of 2022 Reduced Cash Assets
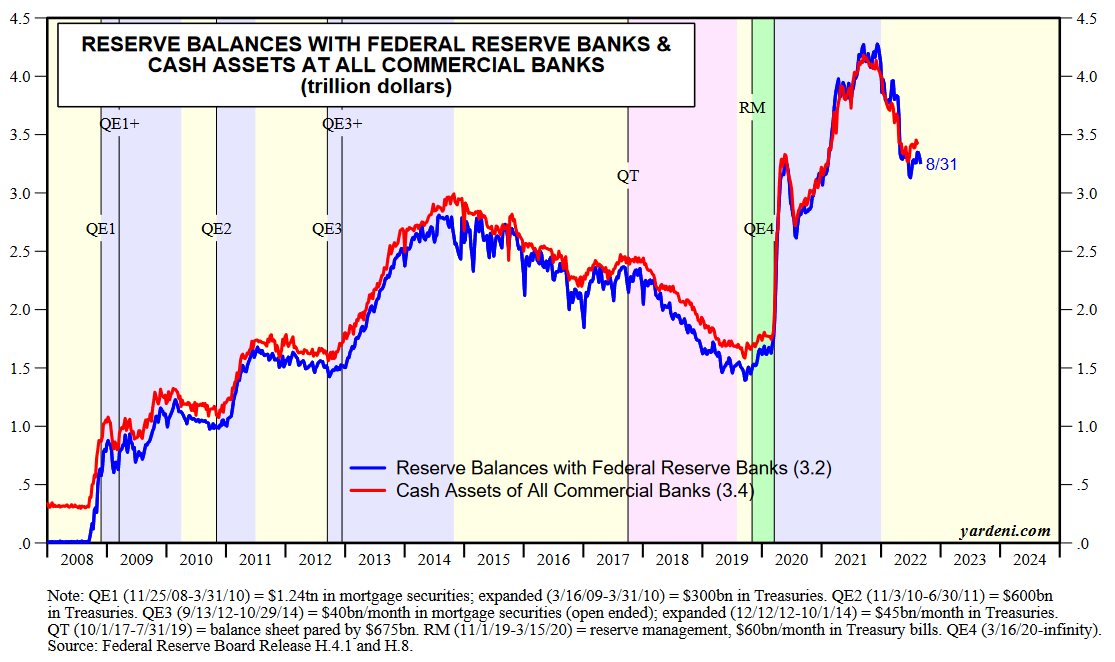
Chart Source: Yardeni Research
Buy Equities
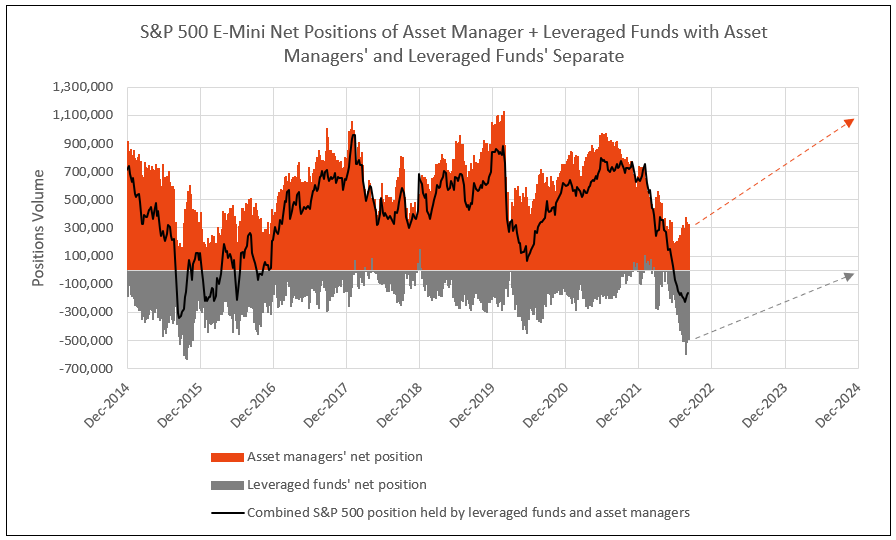
Buy equities on weakness. The fears of inflation and the Fed’s actions, both in open media campaigns from Fed Chairman Powell, other regional presidents, and actions of the open market committee, together, created fear of a potential recession, driving stocks into a bear market in the first half of 2022, leading to a cycle low on June 16. Asset managers represented their bearish view by reducing net long positions in the Mini S&P 500 futures from almost 1 million in mid-2021 to 200,000 in June 2022.Leveraged funds increased the net short Mini S&P 500 futures position from zero at year-end 2021 to a record short position in August 2022, equal to the September 2015 levels (see Chart V).
The levels of 1 million for asset managers and zero for leveraged funds called the market peaks in February 2018, February 2020, and year-end 2021. The max negative levels of net short positions for leveraged funds called the stock market cycle lows in 2015, 2018, 2020 and especially in August 2022 (see Chart IV). In most cases, the cycle low in asset managers’ net long positions matches the extreme negative net short positions of leveraged funds. Note, however, asset managers’ positions bottomed following the June stock market low but leveraged funds did not reach its record low until mid-August 2022.
The record low in negative leveraged fund net short positions in September 2015 did not reach zero until February 2018 (a 3-year bull market). The next major net short low in the second quarter of 2020 did not reach zero until the end of 2021 (a 21-month bull market). The current major low in leveraged fund positions in August 2022 forecasts a potential for a bull market in equities through 2024 (see Chart V).
Chart V
The Next Bull Market in Bank Stocks
Favorable growth in commercial and industrial loans, in addition to stable loan growth for consumers, with a benefit of higher yields on loans more than exceeding the increased cost of funds, provides rising ROE and accelerating EPS growth (see Chart VI and VII).
Chart VI
Favorable Implied Inflation Forecasts the Next Bank Stock Bull Market
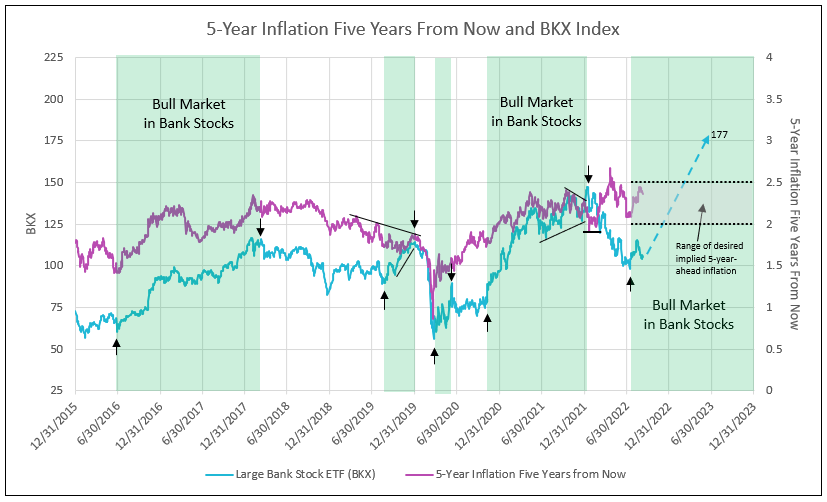
Chart VII
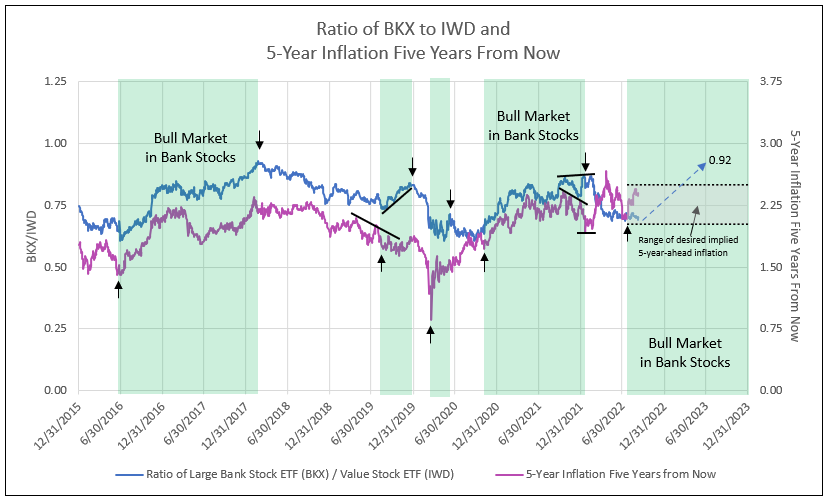
Favorable Implied Inflation Forecasts Bank Stocks to Outperform Value
1 – Tom Lee on Fundstrat, Sept 2, 2022
2 – Tom Lee on Fundstrat, Sept 1, 2022
To view all our products and services please visit our website www.idcfp.com. For more information or to request a copy of this article, please contact us at 800-525-5457 or info@idcfp.com.
John E Rickmeier, CFA
President
jer@idcfp.com
Robin Rickmeier
Marketing Director