Inflation Peaked and Moderates to Under 3% for 2023
The consumer price index for August 2022 increased 8.3%, lower than the 8.5% annual gain in July. Month-to-month CPI change was 0.1%. The peak and decline in oil prices and drop in gasoline prices in July drove half of the monthly decreases.
All items less food and shelter, which has a weight 54% of CPI, fell in July vs June -0.6% and Aug vs July -0.4%. This is monthly deflation.
The Problem
Food and beverages (14.4% of total CPI) was up 1.1% in July and 0.8% in August due to droughts, transportation costs, and small food suppliers and restaurants trying to cover labor and import costs. Medical services (6.8% of total CPI) rose 0.8%, double the July monthly increase of 0.4%. Transportation services (5.9% of total CPI) are volatile, up 0.5% in August compared to -0.5% in July.
Shelter (32% of total CPI), which is rent and owners’ equivalent rent (OER), rose 0.5% in July and 0.7% in August, but we know this is a lagging indicator and a result of housing conditions 24 months ago. The continued increase in the Housing Market Index (HMI) to 84 in December 2021, with a 24-month lead time, clearly forecasts a continued increase in year-over-year rents through December 2022. However, the sharp decline in HMI from 84, to 49 in August 2022, with a 24-month lead time, indicates a rapid decline in both rent and OER to 3% by August 2024, compared to the 6.2% year-over-year reported in August 2022. Rents and OER will fall like a rock in 2023 and 2024.
This is not a hawkish report if you look under the covers. One wonders why the stock market values the past rather than the future in regard to housing inflation.
Core, Flexible and Sticky Prices
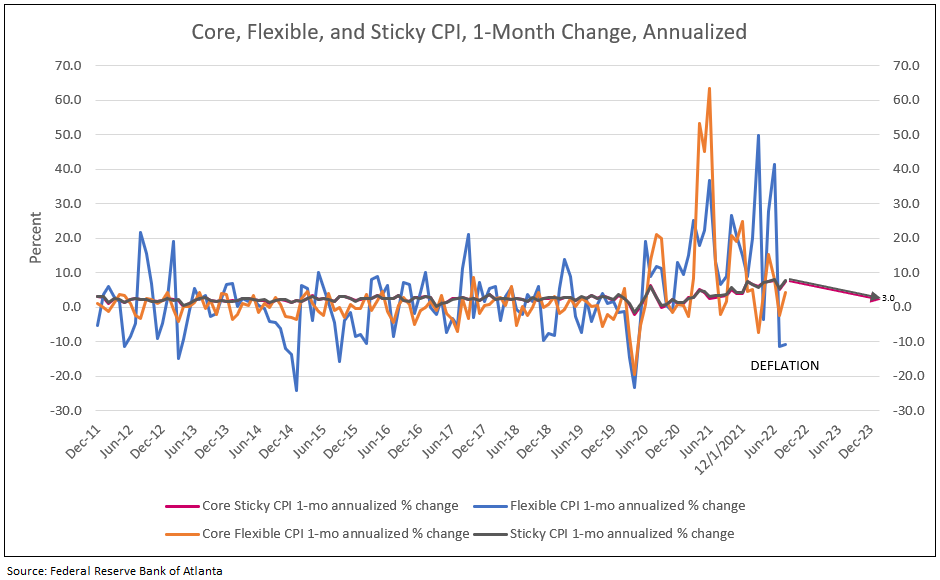
The percent change in flexible one-month price remained at a negative 10%, while core sticky price (due to services mentioned above) remained high but expected to decline to 3% by 2024 (see Chart I and Forecast of Rent below).
Chart I
One-Month Change in Flexible CPI Peaked in the Summer of 2021 and Fell to a Negative 10.0% in August at Annual Rate
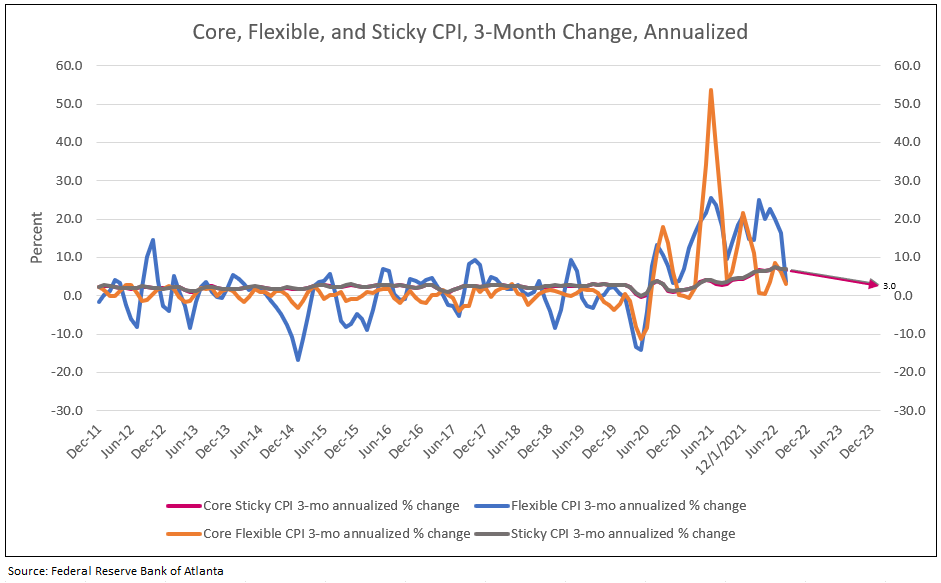
The percent change in flexible 3-month price has been decelerating since early 2022. The change in core flexible 3-month price is also falling. The sticky and core sticky 3-month rate of change peaked in 2022 and forecast to decelerate to 3% by 2024 (see Chart II).
Chart II
All Measures of Inflation Peaked in 2021 and Early 2022
Reasons for Inflation to Moderate for the Remainder of 2022
- Declines in commodity prices led by gasoline declining to under $4 a gallon to $3.70 in September and then $3.25 or even under $3.00 by year-end (see Chart I and Table III).
- Decrease in implied inflation to 2.5% for 5-year and 2.3% for 5-year, 5 years from now (see Chart IV).
- More favorable surveys of inflation and confidence from University of Michigan, New York Fed surveys and Small Business surveys.
- Finally, month-to-month reported CPI, PCE and PPI prices moderate to under 2.4% annualized for the remainder of 2022 (see Table III).
- Six of the nine Federal Reserve regions represented 73% of GDP reported “deflation” in August, up from five of nine regions in July. Regional inflation occured in the Northeast (middle atlantic and new england) where apparel (up 3% due to back to school season) and reescalated electricity costs (high natural gas prices) were the upside surprise.<sup>1</sup>
- Prices paid index for manufacturing fell to 52.5 in August, below the 75-year average of 62. Prices paid index for services was down to 71.5, falling from the recent peak of 85, but still above the 25-year average of 60.1.
- Wholesale prices fell 0.1% in August.
Cass Freight Leads the Fed’s Global Supply Chain Pressure Index (GSPCI) Forecasting Deflation from the Supply Chain in 2023
The regional banks’ Global Supply Chain Pressure Index incorporates data on shipping costs, delivery times, backlogs and other statistics, to create a single measure that can be compared with historical norms.
Another leading indicator, the Cass Freight Index, declined to zero seven months ago, forecasting a drop in GSPCI. By year-end 2022, the GSPCI is expected to decline from 1.75 in August to -1.00, indicating deflation from the supply chain in 2023 (see Chart III).
Chart III
Deflation from Supply Chain in 2023

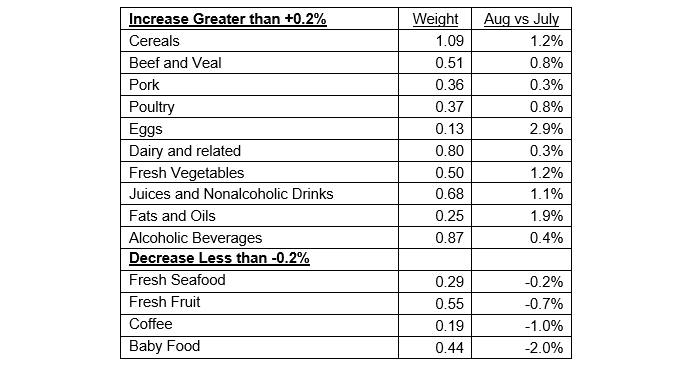
While food prices in August were up 0.8% compared to July, the combined weight of Food to the CPI is 13.5%.
Table I
Food at Home Percent Change Month-to-Month
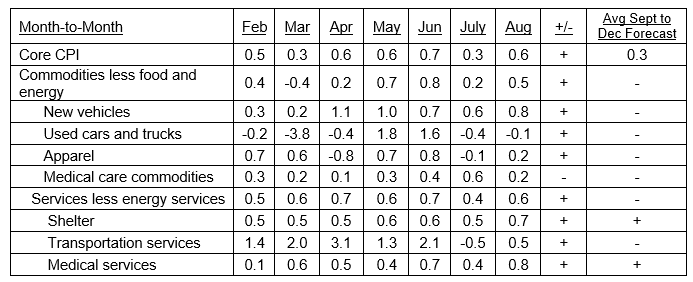
Services less energy services weight is 56.5% of CPI and rose 0.6% in August compared to 0.4% in July. The heavyweight is Shelter at 32.2%, up 0.7% in August. Medical and Educational Services weights of 6.8% and 5.2% were up 0.8% and 1.8%, respectively. Shelter is a lagging price calculation determined from housing indicators 24 months ago. The peak in your-over-year shelter inflation will occur in December 2022 with and the subsequent decline in HMI from 86 to 49 forecasts 3% shelter inflation by August 2024 (see Charts IV and V).
Table II
Services Percent Change Month-to-Month
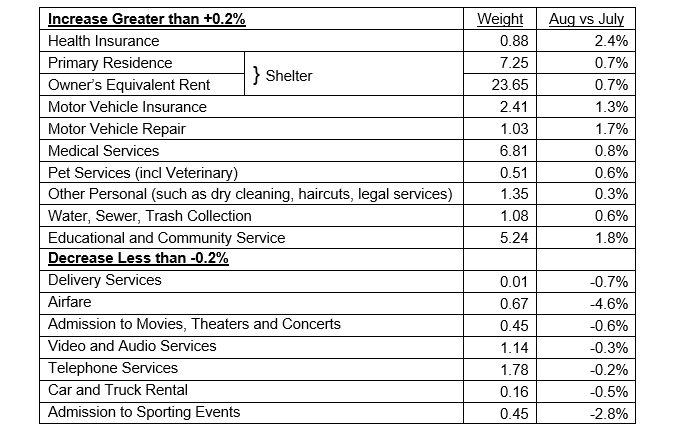
Table III
Percent Change in Core CPI for All Urban Consumers
Recovery in Productivity
Another driver of lower inflation are real wages, with top line CPI falling below the 4.5% wage growth expected by year-end 2022 and 4% forecast in 2023. Growth in real wages stimulates the economy, reversing the decline in productivity.
U.S. nonfarm worker productivity fell at a 4.6% annual dip in the second quarter, following a steep 7.4% rate of decline in the first quarter, the largest in 75 years. Workers put in more hours and produced less. Hours worked increased to a rate of 2.6% in the second quarter, down from an increase of 5.3% in the first quarter. Revisions to 2022 GDP reports, however, will reduce the productivity decline closer to zero.
As worker real wages increase, so does consumption and productivity. A snap back in productivity in 2023 and 2024 reduces unit labor costs or future inflation.2
Barry Knapp of Ironsides Microeconomics said in an interview on CBNC on August 11, “GDP accounting is a mess. Using the income accounts and hours worked indicated positive GDP growth in the first half of 2022 and limited declines in productivity.” JP Morgan economists agree with this forecast for revisions in GDP for the first and second quarter of 2022.
The Sticky Component of Rent, a Lagging Indicator, Retreats from Over 6% to 3% in 2024
Rent component is measured by rent from primary residence (7.2% of CPI) and owners’ equivalent rent (OER, 23.5% of CPI) for a total of 32.2% of CPI, and a large portion of PCE. Rent and OER are best forecast by the NAHB/Wells Fargo Housing Market Index (HMI) with a 24-month lead time.
HMI is based on a monthly survey of NAHB members designed to take the pulse of the single-family housing market. The survey asks respondents to rate market conditions for sale of new homes at the present time and in the next six months, as well as the traffic of prospective buyers of new homes.
HMI peaked in December 2021 at 84 and fell like a rock to 49 in August 2022. With the 30-year mortgage rate increasing to 6%, a further decline in HMI is projected for September. Plotted 24 months forward, HMI forecasts year-over-year monthly change in rent and OER. As a result, the sharp declines in HMI in 2022 with a 24-month lead time forecasts 3% rent and OER inflation in August 2024 (see Charts IV and V).
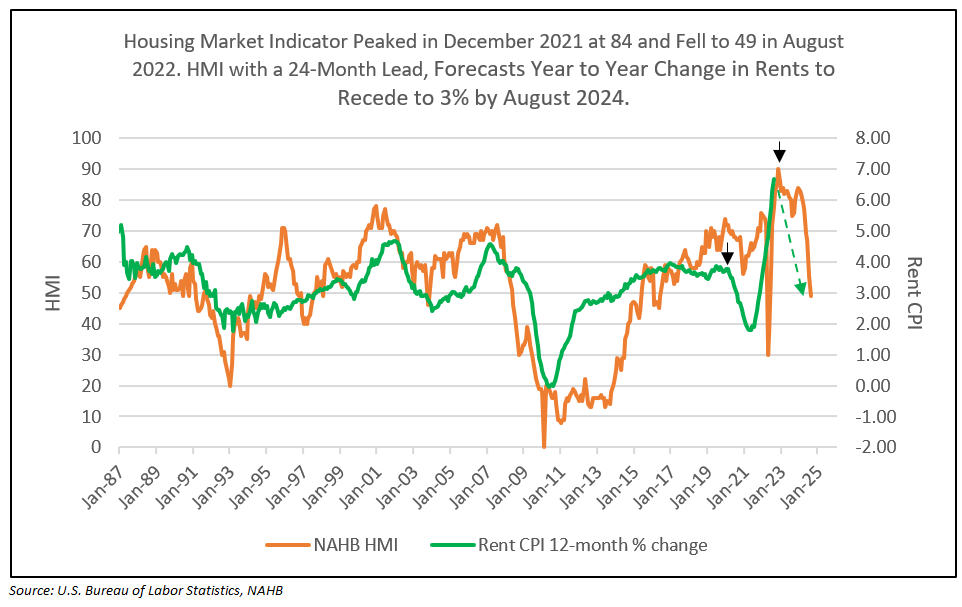
Chart IV
Following the Lead of HMI, Rent Percent Change “Falls Like a Rock” in 2023 and 2024
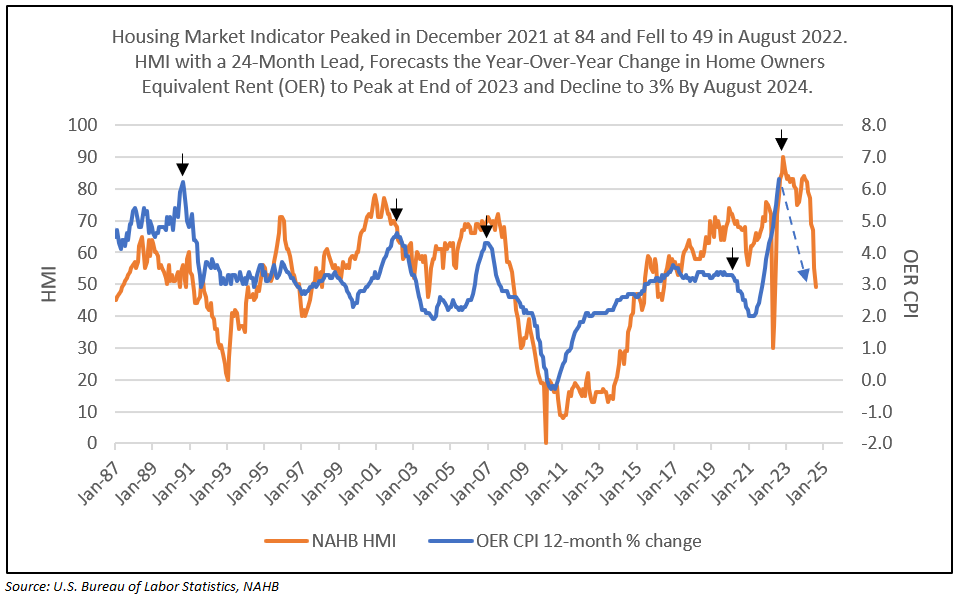
Chart V
Following a Decline in HMI, OER Percent Change “Falls Like a Rock” in 2023 and 2024
The Fed Looks Forward
The Federal Reserve has headquarters in D.C. and 9 regional banks, each with floors of economists and forecasters. HMI and housing prices are a few of the many leading indicators the Fed has developed to forecast each component of inflation. Reported inflation lags, preceded by bond market swaps and implied inflation (nominal minus real yields), commodity prices, industry surveys and other leading industry indicators. Together, these indicators substantially lead reported CPI.
Further Declines in Gasoline are Expected to Lower Consumer Inflation Expectations
The Fed relies on the University of Michigan (UoM) inflation expectation one and three years forward. UoM shows that the price of gasoline is a huge influence on consumer expectations. Gas prices will decline in September below $3.75, and even to $3.50 in some states, with UoM inflationary expectations three-year horizon falling to 2.8% in September from 3.2% in August.
How much Reduction in Inflation is Sufficient to Meet the Fed’s Target?
The only inflation target we hear about from Fed speak to the media is to drive core PCE to 2%, yet the best measure of inflation remains levels implied by the bond market.
Implied inflation is a bond market measure.
- The 5-year T-Note yield less the 5-year inflation-indexed yield.
- The 10-year T-Note yield less the 10-year inflation-indexed yield.
- Five-year implied inflation 5-years-from-now (or 5-year minus 10-year implied inflation subtracted from the 10-year implied inflation rate, resulting in the implied inflation for the last 5 years of the next 10-year period.) Short-term implied inflation can also be measured over 1-, 2- or 3-year periods.
A picture of deflation.
Deflation is illustrated by measures of implied inflation, when the 10- and 5-year implied inflation rates are less than the 5-year rate 5-years in the future. Chart III illustrates the deflation that reigned from 2015 to 2020. The 5-year rate 5-years ahead remained slightly above and, at times, below 2%, while 5- and 10-year implied inflation continuously fell below this 5-year-ahead rate. The Fed does not desire this deflation outcome in the future.
A picture of controlled inflation.
Inflation is illustrated by 5- and 10-year implied inflation continuously greater than the 5-year-ahead rate. Levels of the 5- and 10-year implied rates above 2.5% are excessive and require Fed action, by both their media campaign and open market committee.
Implied inflation by all measures tumbled in the first half of 2022. Five and 10-year yields fell to 2.5% and the 5-year-ahead rate dropped to a little over 2%. Currently, 2-year implied inflation is at 3.2%, while 5-year is at 2.6%, 10-year is at 2.5%, and 5-years-ahead inflationrate is at 2.3%. Note the 5- and 10-year implied rates are always above the 5-year-ahead rate, a picture of inflation expectations… and with rates 2.5% or less, a picture of controlled inflation.
While implied inflation measures were at the high end of the acceptable range, sharply falling inflationary components in 2022 and 2023 are expected to reduce current implied inflation levels closer to 2% the remainder of 2022 and the year 2023 (see Chart VI).
Chart VI
All Implied Inflation Readings Decline to Acceptable Levels

Professor Who Called Inflation Surge Says Fed Should Go Slow Now
Dr. Jeremy Siegel, Emeritus Professor of Finance at the University of Pennsylvania’s Wharton School of Business said, “the Fed should not get overly aggressive right now,” Dr Siegel sees inflation peaking and falling sharply in particular areas. He indicated “the CPI and PCE, the way these gauges are constructed, lag what is actually happening in the real world.” He echoed the evidence we presented above, as well as the continuous forecast by Tom Lee of Fundstrat, J.P. Morgan strategists, Goldman Sachs economists, and many more.
Peak in Fed Funds Rate
The current Fed funds rate, as forecast by the futures market, peaks at 4% in March 2023 and then declines toward 3.5% by March 2024. Given the above outlined forecast of a dramatic decline in inflation in 2023 and levels reaching 2% area in 2024, the Fed funds rate could peak under 4% as the Fed realizes the degree of moderation in inflation in 2023.
Buy Equities
Buy equities on weakness. The fears of inflation and the Fed’s actions, in open media campaigns from Chairman Powell, other regional presidents, and actions of the open market committee, together, created fear of a potential recession. This fear drove stocks into a bear market in the first half of 2022, with a cycle low on June 16.
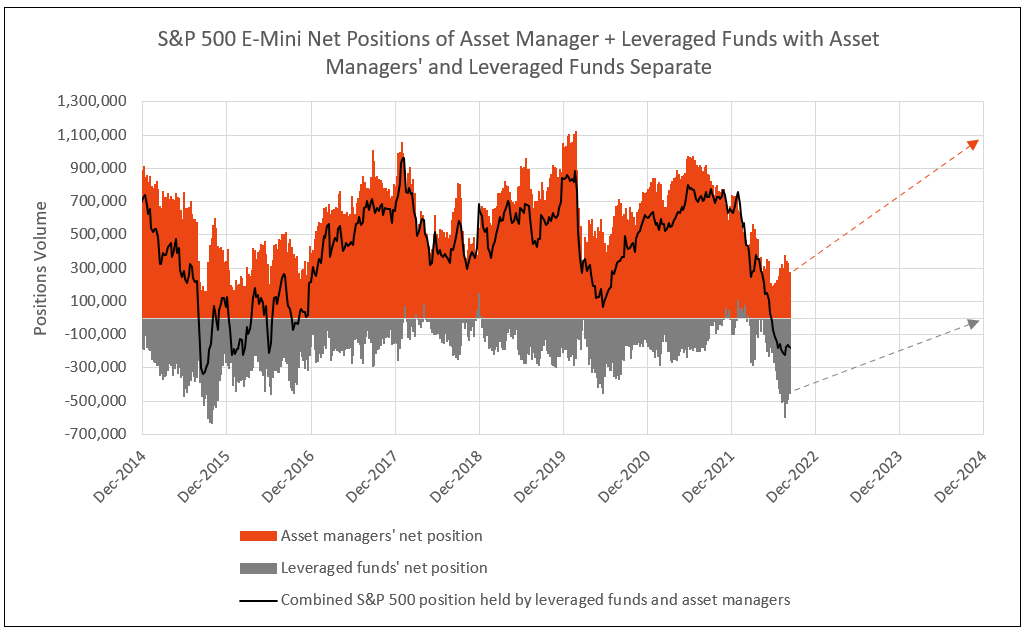
Asset managers represented their bearish view by reducing net long positions in the Mini S&P 500 futures from almost 1 million in mid-2021 to 200,000 in June 2022. Leveraged funds increased the net short Mini S&P 500 futures position from zero at year-end 2021 to a record short position in August 2022, equal to the September 2015 levels (see Chart VII).
The contract levels of 1 million for asset managers and zero for leveraged funds called the market peaks in February 2018, February 2020, and year-end 2021. The max negative levels of net short positions for leveraged funds called the stock market cycle lows in 2015, 2018, 2020 and especially in August 2022. In most cases, the cycle low in asset managers’ net long positions matches the extreme negative net short positions of leveraged funds. Note, however, asset managers’ positions bottomed following the June stock market low, but leveraged funds did not reach its record low until mid-August 2022.
The record low in negative leveraged fund net short positions in September 2015 did not reach zero until February 2018 (a 3-year bull market). The next major net short low in the second quarter of 2020 did not reach zero until the end of 2021 (a 21-month bull market). The current major low in leveraged fund positions in August 2022 forecasts a potential for a bull market in equities through 2024 (see Chart VII).
Chart VII
In the September Bank of America survey of Institutional Investors, the overweight/underweight for equities reached a record underweight low, below March 2009 (Chart VIII). This is due to the recession odds at near record highs of March 2009 and April 2020 (Chart IX). The record negative in leveraged fund net short futures, combined with the degree of underweight equity positions by institutional investors, provides a buying opportunity.
Chart VIII
Institutional Investors Record Bearish Reading in September 2022

Chart IX
Fear of Recession in September 2022 Near Record Highs of March 2009 and April 2020
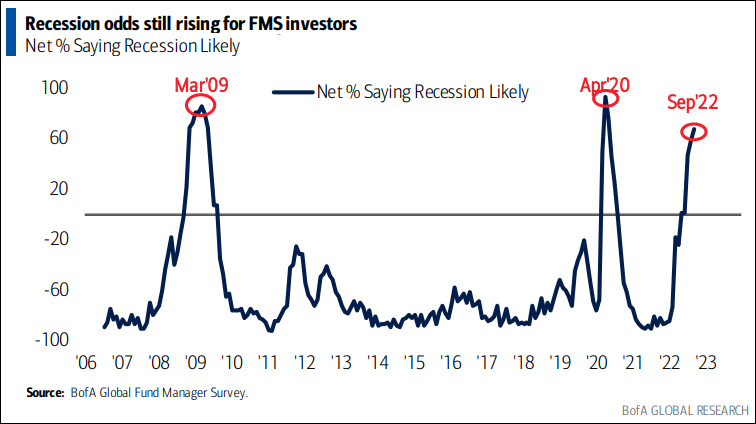
So, the question is, were you a buyer of equities in March 2009 and in April 2020?
1 Tom Lee of Fundstrat, September 14, 2022
2 From an interview with Jeremy Siegel, Professor of Finance at Wharton.
Let IDC provide you the value and financial history of your favorite bank stock. For you to better understand our process of valuation, we offer a free, one-time analysis of one of the 202 banks in our bank analysis database. Simply send your request with the bank stock symbol to info@idcfp.com.
To inquire about IDC’s valuation products and services, please contact jer@idcfp.com or info@idcfp.com or call 262-844-8357.
John E Rickmeier, CFA
President
Robin Rickmeier
Marketing Director