Peak and Dramatic Decline in Inflation, Coupled with Risks in Currency and Yield Spreads, and Effects of Ukraine War, Make It Difficult to Estimate the Precise Low in Bear Stock Market
Previously Recommended to Buy on Weakness. Now, Simply Buy.
Key Takeaways
- Federal Reserve officials are starting to stake out different views on how fast to raise interest rates as they balance hot inflation against rising stress in the financial markets.
- Bank of America says credit stress is at a “borderline critical level” beyond which dysfunction begins.1
- Events outside of the Fed raise in yields reduced implied inflation rates to 2.14% for 1 year, 2.14% for 5 years, 2.15% for 10 years and the 5-years-ahead rate to 2.16%. This is deflationary condition, with the front end below the longer yields, which the Fed desires to avoid and, therefore, moderates future increases in Fed funds (see Chart IV).
- U.S. home prices are now posting the biggest monthly drop since 2009. The normal 24-month lead time of HMI to estimate rent and owner’s equivalent rent (OER) is reduced because of this sharp price decline, forecasting these PCE components to decline in 2023 to 2.5%.
- The ISM’s September report, with the increase in the “percent reporting lower price paid,” coupled with UofM’s report of longer-term inflationary expectations of 2.7% (below the 50-year average of 3.0%), plus weakening of other lending inflation indicators, all forecast declines in backward looking CPI and PCE in 2023 to 2.5%.
- Ed Yardeni recommended the Fed should consider ending its tightening campaign after one more rate hike in November.
- Buy stocks on weakness was recommended. Now, simply buy. With the low probability of recession, buy bank and other value stocks.
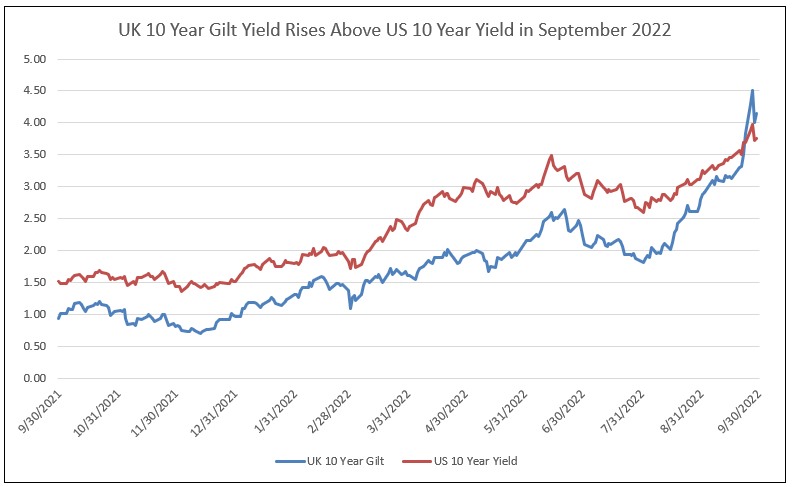
While inflation peaked in 2022, the U.S. 10-year continued to increase to new highs in September 2022 in anticipation of Fed fund increases or external influences.
The New Problem = UK 10 Year Gilt
The U.S, 10-year priced rising inflation in 2022, reaching a peak of 3% in April and a new high level of 3.5% in June. As illustrated in Chart I, the yield on the UK 10 Year Gilt paralleled the rise in the U.S. 10-year T-Note yield. Beginning in August 2022, however, the UK gilt rose more rapidly than the U.S. yield due to budgetary, inflationary, and monetary policies in the UK, as well as unsettled EU-UK agreements and the impacts of the Ukraine war.
The peak yield of 4% in the U.S. 10-year was, in our opinion, not due to higher inflation expectations or Fed actions, or even a reflection of Federal Reserve heads speaking, but a result of unique problems in the UK. Intervention by the UK central bank buying UK Gilts occurred when the UK yield exceeded the U.S. yield in late September 2022 (see Chart I).
Inflation in Europe due to the Ukrainian war with Russia, sabotage of the underwater gas pipeline from Russia to Germany, and the dysfunction of the Russian military in the war with its associated risks, all create extraordinary risks to bond yields and investing in U.S. stocks, correcting stocks in September to market lows.
However, inflation peaked this year, and by examining forward indicators of futures plus implied inflation, 2023 inflation will be under control, within the range of 2% to 2.5%.
Chart I
The Sticky Component of Rent
Rent component is measured by rent from primary residence (7.2% of CPI), and owners’ equivalent rent (OER, 23.5% of CPI). Together, these total 32% of CPI, but only 15.8% of PCE. Rent and OER are best forecast by the NAHB/Wells Fargo Housing Market Index (HMI) with a 24-month lead time.
HMI is based on a monthly survey of NAHB members designed to take the pulse of the single-family housing market. The survey asks respondents to rate market conditions for sale of new homes at the present time and in the next six months, as well as the traffic of prospective buyers of new homes.
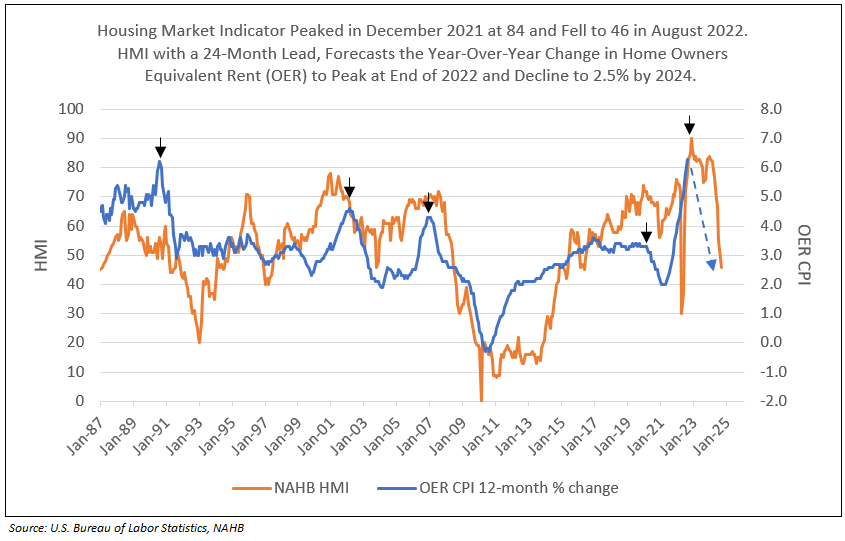
HMI peaked in December 2021 at 84 and fell to 46 in August 2022. With the 30-year mortgage rate increasing to 7.00%, a further decline in HMI is projected for September and October. Plotted 24 months forward, HMI forecasts year-over-year monthly peak in rent and OER by year-end 2022. As a result, the sharp declines in HMI forecast the significant decline in year-to-year percent change in both rent and OER. HMI plotted 24 months ahead forecasts 2.50% rent and OER inflation in late 2023 or early 2024 (see Table II, Charts II and III).
Chart II
Following the Lead of HMI, Rent Percent Change “Falls Like a Rock”
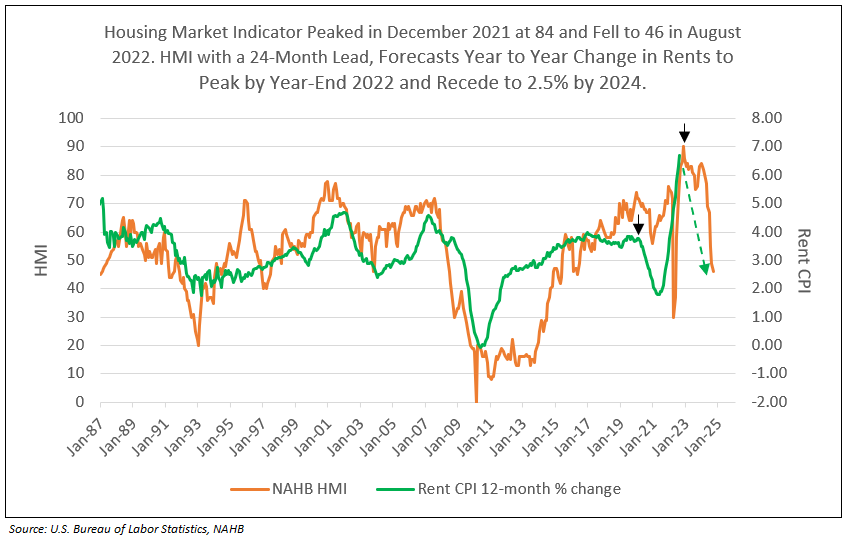
Chart III
Following a Decline in HMI, OER Percent Change “Falls Like a Rock”
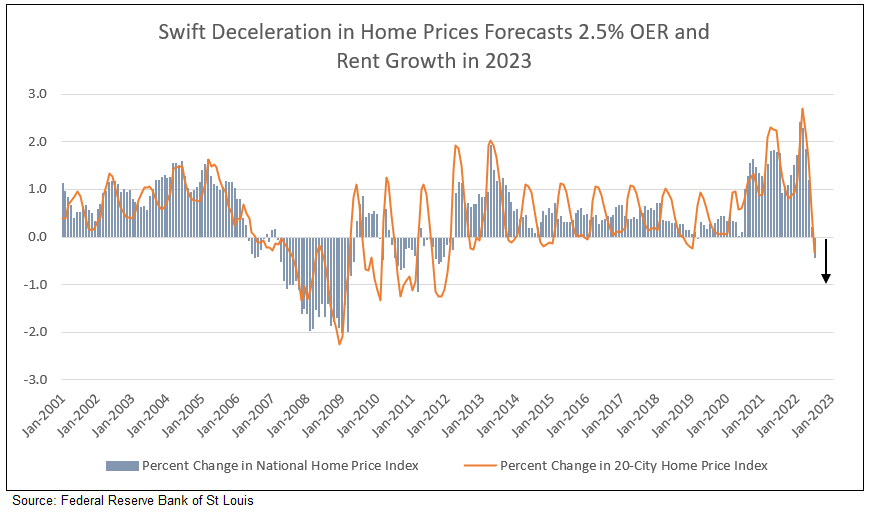
U.S. Home Prices Now Posting Biggest Monthly Drops Since 2009
Median home prices fell 0.98% in August from a month earlier, following a 1.05% drop in July, according to mortgage provider Black Knight.2 The sharp decline in home prices, more rapid than the decline from 2007 to 2008, indicate the 2.5% year-to-year growth in rent and OER could occur as early as 2023.
Chart IV
Short Term Implied Inflation
IDC Uses a Family of inflation indexes
- 1 Year Expected Inflation (INFL 1Y): Expected inflation over the next 12 calendar months (i.e., the market implied expectation for realized inflation over the course of the next year, starting from the latest published CPI) 3
- 4 Year Expected Inflation, 1 Year from Now: Expected longer term inflation in one year’s time (i.e., the market implied four-year inflation expectation one year forward)
- 5 Year Expected Inflation, 5 Years from Now: Expected longer term inflation in five years’ time. (i.e., the market implied five-year market inflation expectation five years forward)
Inflation Expectations
Current indicative values for Inflation Expectations Indexes can be found in Table III below, set alongside historical indicative data points from July 1 and January 4 of 2021.
Table III
Current indicative values for U.S. Dollar Inflation Expectations Indexes
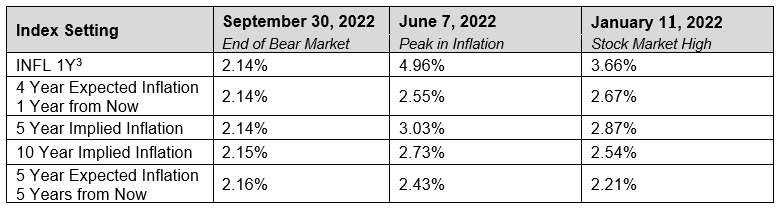
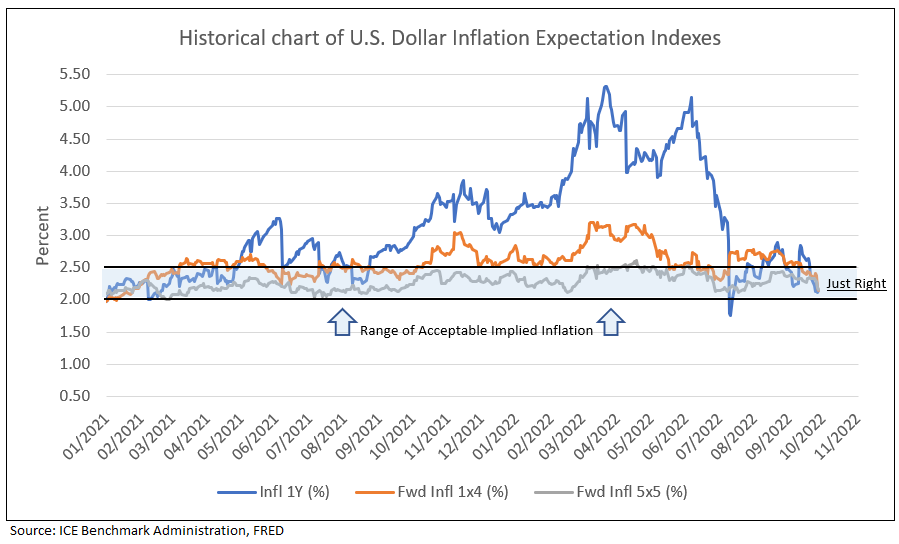
Chart V
University of Michigan Survey of Consumers
University of Michigan (UofM) survey of consumer expectations for the median expected year-ahead inflation rate declined to 4.7%, the lowest reading since September 2021. The median long run inflation expectations fell to 2.7%, and below the 2.9% to 3.1% range for the first time since July 2021.
The year-ahead consumer expectation of 4.7% inflation compares to the futures (ICE) measure of 2.3%. By all measures, back-looking reported inflation peaked and is declining.
The Fed Looks Forward
The Federal Reserve has headquarters in D.C. and 12 regional banks, each with floors of economists and forecasters. HMI is only one of many leading indicators the Fed has developed to forecast each component of inflation. Reported inflation lags are also preceded by the bond market swaps and implied inflation (nominal minus real yields), and commodity prices, industry surveys and other leading industry indicators substantially lead reported CPI.
How much Reduction in Inflation is Sufficient to Meet the Fed’s Target?
The only inflation target we hear about from Fed speak to the media is to drive core PCE to 2%, yet the best measure of inflation remains levels implied by the bond market.
Implied inflation is a bond market measure.
- The 5-year T-Note yield less the 5-year inflation-indexed yield.
- The 10-year T-Note yield less the 10-year inflation-indexed yield.
- Five-year implied inflation 5-years-from-now (or 5-year minus 10-year implied inflation subtracted from the 10-year implied inflation rate, resulting in the implied inflation for the last 5 years of the next 10-year period.) Short-term implied inflation can also be measured over 1 or 4-year periods.
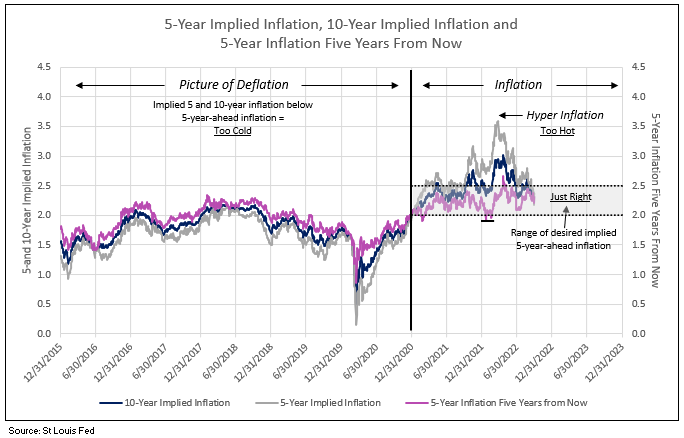
A picture of deflation.
Deflation is illustrated by measures of implied inflation, when the 10- and 5-year implied inflation rates are less than the 5-year rate 5-years in the future. Chart III illustrates the deflation that reigned from 2015 to 2020. The 5-year rate 5-years ahead remained slightly above and, at times, below 2%, while 5- and 10-year implied inflation continuously fell below this 5-year-ahead rate. The Fed does not desire any deflation outcome in the future.
A picture of controlled inflation.
Inflation is illustrated by 5- and 10-year implied inflation continuously greater than the 5-year-ahead rate. Levels of the 5- and 10-year implied rates above 2.5% are excessive and require Fed action, by both their media campaign and actions of the open market committee.
Implied inflation by all measures tumbled in the first half of 2022. Five and 10-year yields fell to 2.5% and the 5-year-ahead rate dropped to a little over 2%. However, today the 1-year implied inflation is at 2.14%, while 5-year is at 2.14%, 10-year is at 2.15%, and 5-years-ahead inflation rate is at 2.16%. This is a picture of potential deflation, and an outcome not desired by the Fed. This pattern indicates the expected increase in the Fed funds rate is excessive.
The increase in the UK Gilt yield raised the U.S. T-Note yield to levels that tighten liquidity beyond Fed requirements. The dramatic rise in U.S. yields, both nominal and real, reduced the implied inflation yield curve as noted above, creating a deflationary picture (as occurred in 2015 to 2020 – see Chart VI).
Chart VI
The Yield Curve as a Predictor of Recession Forecasts No Recession in 20234
The Federal Reserve Bank of New York in a June 1996 study noted “one of the most successful models in our study estimates the probability of recession four quarters in the future as a function of the current value of the yield curve spread between the 10-year Treasury note and the 3-month Treasury bill.”
This current critical yield spread is 38 basis points, indicating a 15 to 20% probability of recession. In the recent past the spread ranged from 46 to 76 basis points, forecasting a 10 to 15% probability. The spread would be required to turn negative to reach a 30 to 40% probability of recession.
Economist Who Called Inflation Surge Says Fed Should Go Slow Now
Dr. Jeremy Siegel, Emeritus Professor of Finance at the University of Pennsylvania’s Wharton School of Business said, “the Fed should not get overly aggressive right now,” Dr Siegel sees inflation peaking and falling sharply in particular areas. He indicated “the CPI and PCE, the way these gauges are constructed, lag what is actually happening in the real world.” He echoed the evidence we presented above, as well as the continuous forecast by Tom Lee of Fundstrat, Ed Yardeni, and many more.
Ed Yardeni’s take is that the Fed should consider ending its tightening campaign after one more rate hike in November. He added, the stress in financial markets from big rate increases, a surging dollar and quantitative tightening has reached the point that officials should make financial stability the top priority.2
Peak in Fed Funds Rate
The current Fed funds rate, as forecast by the futures market, peaks over 4.0% by March 2023 and declines in 2024. Given the above outlined forecast of a dramatic decline in inflation reaching 2% area in 2023, the Fed funds rate peaks at 3.5% to 4.0%, as the Fed and futures market realizes the degree of moderation in inflation.
Buy Equities
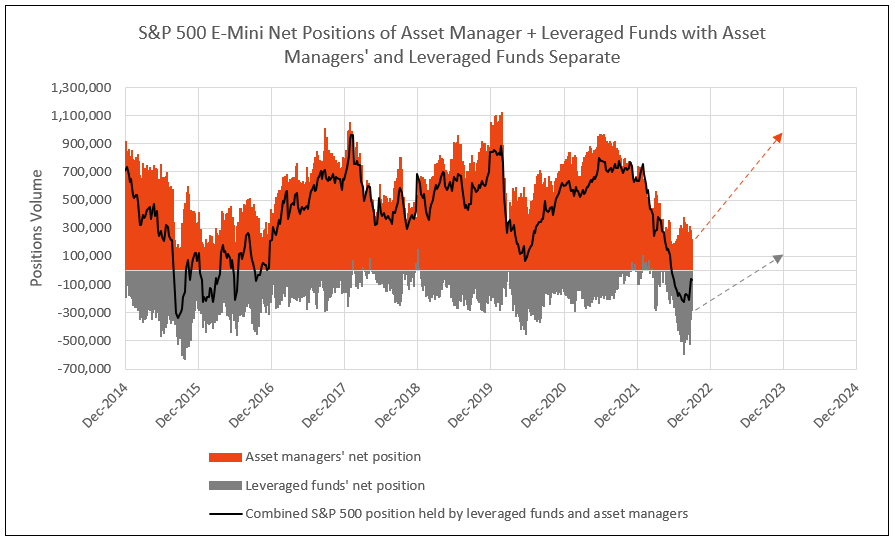
The past recommendation was to buy equities on weakness. The fears of inflation and the Fed’s actions, both in open media campaigns from Fed Chairman Powell, other regional presidents, and actions of the open market committee, together, created fear of a potential recession, driving stocks into a bear market in the first half of 2022, leading to a cycle low on June 16. Asset managers represented their bearish view by reducing net long positions in the Mini S&P 500 futures from almost 1 million in mid-2021 to 200,000 in June 2022.Leveraged funds increased the net short Mini S&P 500 futures position from zero at year-end 2021 to a record short position in August 2022, equal to the September 2015 levels. In September 2023, the leveraged funds reduced the net short position in half, a bullish trend (see Chart VII).
The levels of 1 million for asset managers and zero for leveraged funds called the market peaks in February 2018, February 2020, and year-end 2021. The max negative levels of net short positions for leveraged funds called the stock market cycle lows in 2015, 2018, 2020 and especially in August 2022 (see Chart IV). In most cases, the cycle low in asset managers’ net long positions matches the extreme negative net short positions of leveraged funds. Note, however, asset managers’ positions bottomed following the June stock market low but leveraged funds did not reach its record low until mid-August 2022.
The record low in negative leveraged fund net short positions in September 2015 did not reach zero until February 2018 (a 3-year bull market). The next major net short low in the second quarter of 2020 did not reach zero until the end of 2021 (a 21-month bull market). The recent major low and reversal in leveraged fund positions forecasts a potential for a bull market in equities through 2023 (see Chart VII).
Chart VII
In the September Bank of America survey of Institutional Investors, the overweight/underweight for equities reached a record underweight low, below March 2009 (Chart VIII). This is due to the recession odds at near record highs of March 2009 and April 2020 (Chart IX), yet, in 2022, there is low probability of a recession forecast for 2023. The record negative in leveraged fund net short futures, combined with the degree of underweight equity positions by institutional investors, provides a buying opportunity.
Chart VIII
Institutional Investors Record Bearish Reading in September 2022
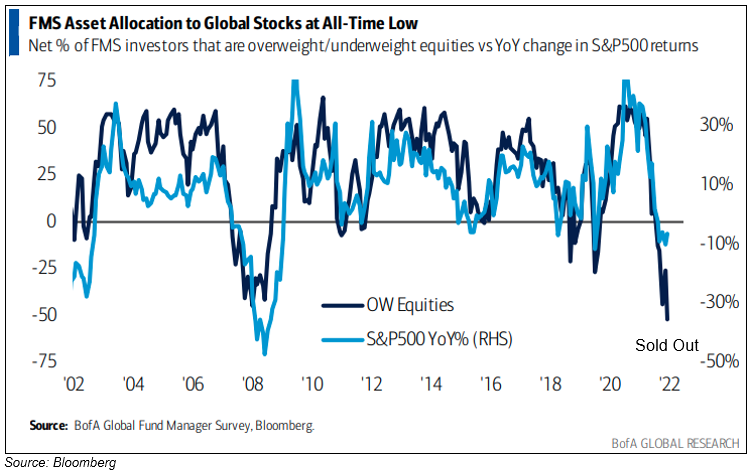
Chart IX
Fear of Recession in September 2022 Near Record Highs of March 2009 and April 2020
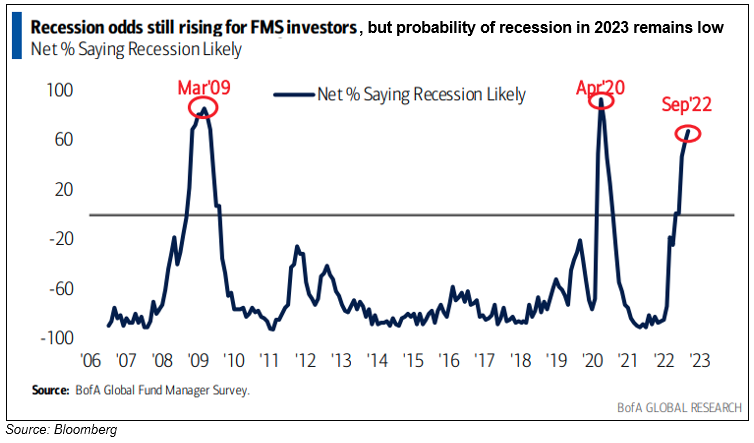
So, the question is, were you a buyer of equities in March 2009 and in April 2020?
1 – Bloomberg, Oct 1, 2022
2 – Bloomberg, Oct 3, 2022.
3 - ICE U.S. Dollar Inflation Expectations Index Family
4 – Tom Lee First Word, Fundstrat, Oct 3, 2022.
To view all our products and services please visit our website www.idcfp.com. For more information or to request a copy of this article, please contact us at 800-525-5457 or info@idcfp.com.
John E Rickmeier, CFA
President
jer@idcfp.com
Robin Rickmeier
Marketing Director