Why the Federal Reserve Should Pause Right Now
Milton Friedman famously said: “Inflation is always and everywhere a monetary phenomenon, in the sense that it is and can be produced only by a more rapid increase in the quantity of money than in output.”
Chart I
M2 Money Supply Growth Vs Inflation History 1943 – 2022
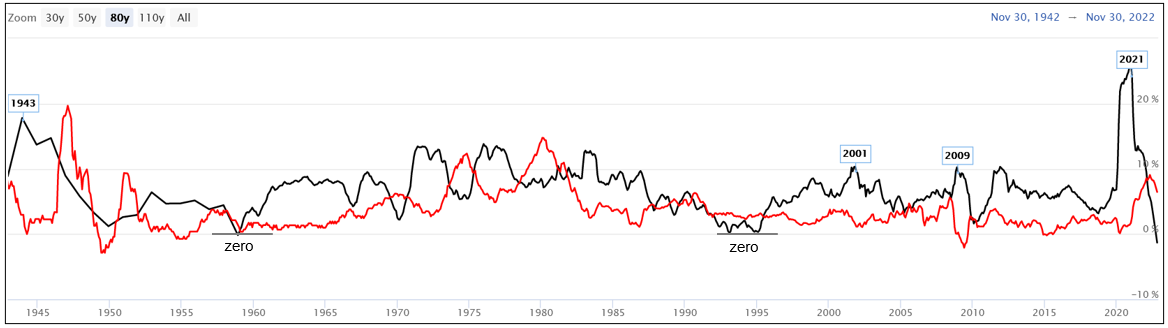
Chart I Source: Longtermtrends
M2 money supply growth accelerated from 3.2% in the fourth quarter of 2018 to 27% in the second quarter of 2021, the highest in 150 years. In the second quarter of 2020, inflation reached a low, but the Fed failed to raise the Fed funds rate, to control accelerating inflation that followed in 2021 and 2022, until March of 2022 (see Chart I).
Following its peak at 27%, M2 money supply made a round trip and fell to -1.3% in December 2022. Based on its 24-month lead time, CPI inflation is expected to peak in the fourth quarter of 2022 and recede to 2.5% or less by the end of 2023 or sooner. Given this outlook, why would the Fed continue to raise the Fed Funds rate above 4.75% level, following the 25-basis point hike in February. Is the Fed about to make another mistake?
Key Takeaways from M2 Growth and Inflation
- Since 1945, M2 Money Supply annual growth has remained positive, reaching its lowest level near zero in 1960 and from 1993 to 1995 (see Chart I).
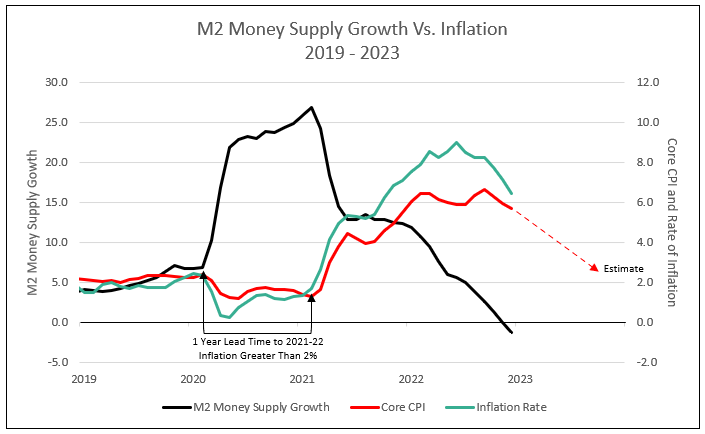
- Increasing the Fed funds rate and quantitative tightening by reducing the Fed’s balance sheet, coupled with a slowing economy, reduced M2 growth to negative 1.3% in December 2022, the first negative reading since World War II (see Chart II).
- Reported CPI inflation approaching 2% at a 3-month annualized rate, implied inflation less than 2.75% over 1, 5 and 10 years, decelerating PPI inflation toward 2% annualized over 3 months, and consumer expectations of lower inflation with wage growth approaching 3%, all indicate an end to Fed tightening.
- Central Bank of Canada has paused its rate hikes.
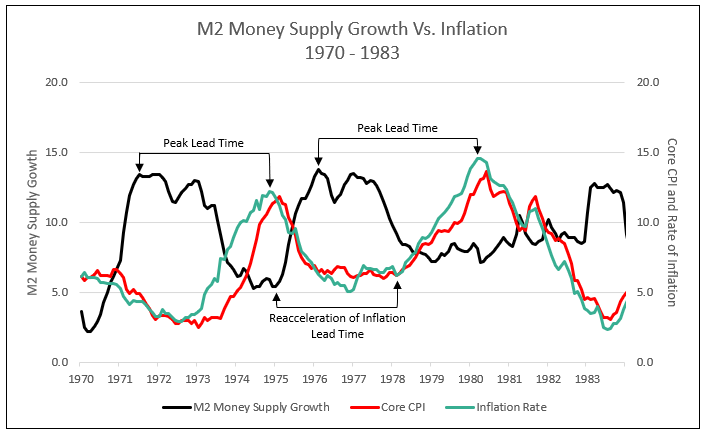
- The Fed fear of a recurrence of inflation, like what occurred from 1973 to 1980, can be contained by limiting M2 growth in the future (see Chart IV).
Growth in the Money Supply Has Contracted to Negative Levels
If you believe in the Milton Friedman adage cited above, then you should also believe that the Federal Reserve can stop increasing interest rates. Now.1
The Fed raising its target rate rapidly from near zero early last year to 4.75% by February 2023 makes sense not just with core inflation surging above 6%, but also with the money supply measured by M2 soaring by almost $6 trillion, or some 41%, as the government flooded the economy with cash to support consumers and businesses during the pandemic.1 The magnitude of the increase in M2 in 2020 and 2021 reduced the lead time to accelerating inflation to 1 year, compared to 4 years in the late 1970’s (see Charts II & IV).
Chart II
Unprecedented Contraction
The Fed’s rate increases, which came at a pace not seen since the early 1980s, have had a hand in reducing the money supply and the excess savings that consumers accumulated during the pandemic. In essence, consumers have had to tap into their savings to cover higher interest payments on everything from mortgages to auto loans and credit card balances — or to avoid them by paying cash for bigger-ticket goods. The real estate market is a prime example. Some 30% of homes purchased in December were bought with cash, the highest percentage in eight years, according to property research firm Redfin.1
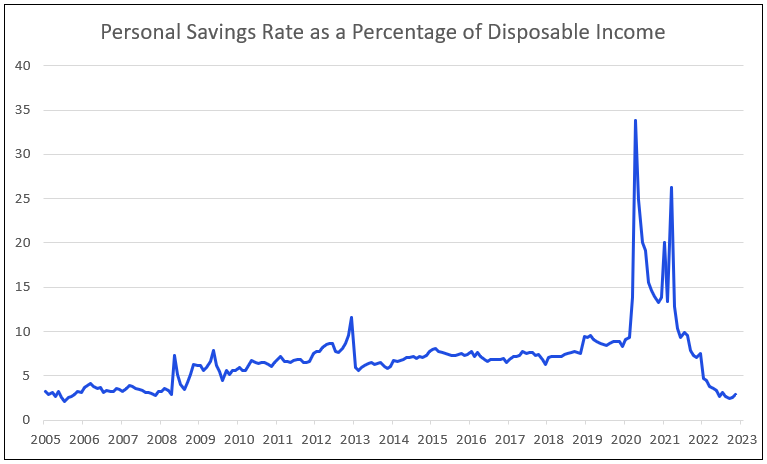
All of this is reflected in the saving rate, which has fallen significantly, dropping to a low of 2.4 in September 2022, from more than 7% a year earlier, and marked the lowest level since 2005. The savings rate recovered modestly to 3.4% in December as goods consumption declined, despite higher disposable personal income (see Chart III). The decline perfectly matches the drop in the broader measure of M2 from a high of $21.7 trillion in March to $21.2 trillion in December.1
Chart III
The Savings Rate Has Dropped to its Lowest Since 2005
These patterns in the data also suggest lower-income and middle-class Americans are holding off on major purchases to avoid having high interest payments cut into their checking account balances, while the more affluent keep the economy going with all-cash purchases. Some of this can be seen in the December retail sales report from the Commerce Department last Wednesday. It showed purchases among a control group of consumers tumbled 0.7% last month, the most since December 2021 and more than the double the 0.3% drop forecast by economists surveyed by Bloomberg. The control-group results are important because they feed directly into the gross domestic product calculations.1
The other thing to consider is that if consumer spending, which accounts for about two-thirds of the economy, is starting to soften, it should help to contain — or even pull down — inflation. This is where all those cash buyers for real estate come in. These purchasers are likely to be landlords, creating more supply in the rapidly weakening rental markets. RealPage Analytics estimates that apartment demand turned negative in the last quarter of 2022, the first time since 2009. Apartment List says rents fell nationally every month in the fourth quarter, adding to the recent disinflationary trend we’ve seen of late in the broad economy.1 Yet, the shelter component of core CPI and PCE remains at historic peak levels.
This all has major implications for monetary policy. The Fed has made it clear that it’s willing to drive up unemployment in an effort to cool consumer spending and bring an end to the worst bout of inflation the US has experienced in four decades. But the slowdown in consumer spending and the easing of inflation is happening with a tight labor market that has kept the unemployment rate at a 50-year low of 3.5% — increasing the odds of a so-called soft landing in the economy and avoiding a recession.1
Put another way, the latest data are starting to suggest the economy might not require such fine tuning from the Fed after all. So, policymakers have the bandwidth to avoid raising rates after the 25-basis point hike next week and allow additional data to either confirm or reject the thesis that the money supply and the broader economy are nearly in balance again. James Bullard, the influential president of the Federal Reserve Bank of St. Louis, hinted several weeks ago that he might be open to such an approach. Bullard noted that M2 provided a strong signal during the pandemic that faster inflation was on its way and the Fed should consider that the money-supply measure is falling now.1
It’s not clear that the Fed needs to be restrictive. It simply needs to support the trends that are already taking hold, and that means halting the rate increases — at least for now.1
1970’s and 1980’s Inflation and the Fed
M2 money supply growth accelerated in the early 70’s, creating an inflation bubble in 1975. A reacceleration of M2 growth in 1975 and 1976 reignited inflation in 1979 and 1980 with a 4-year lead time (see Chart IV).
Chart IV
Conclusion
With the rise in the Fed funds rate and quantitative tightening reducing M2 growth to negative readings, the Fed risks creating a major recession. But inflation has already been approaching reduced levels of 2% over the last 3 to 6 months, so the need to tighten further is limited.
Any resurgence in M2 growth in 2023 or 2024 can easily be contained with monetary tightening, as M2 growth leads inflation by 1 to 4 years (see Charts II & IV). To risk negative growth in M2 seems overkill by the Federal Reserve.
The Case for the Federal Reserve to Pause Right Now, Bloomberg Opinion, January 24
To inquire about IDC’s products and ranking services, please contact jer@idcfp.com or info@idcfp.com or call 262-844-8357.
John E Rickmeier, CFA
President
Robin Rickmeier
Marketing Director