The Differences Between CPI and PCE and the Fed’s Targets to Control Inflation
For years, IDC Financial Publishing (IDCFP) has been covering and analyzing the reported Consumer Price Index (CPI), released by the Bureau of Labor Statistics (BLS), and the Personal Consumption Expenditures (PCE) released by the Bureau of Economic Analysis (BEA). The BEA puts together the national accounts that make up the GDP, and the Fed uses PCE price index as a gauge for inflation targets.
Both the CPI and PCE indexes revealed some surprising results in December and January, driven by a jump in services inflation. Consumer spending, supported by higher wages, is what make up the majority of services inflation.
An Explanation of the Differences by the Fed Governor
There are big differences between CPI and PCE indexes, however, each drawing from different data, with varying weights. Fed Governor Philip Jefferson, speaking via video at a Harvard University economics class, outlined the differences. Following are some excerpts that break down the differences in a simplified, easy-to-understand way.
- “Both indexes measure inflation using a specific basket of goods and services consumed by households. These baskets are similar but not identical across the two measures.
- “Both measures also weight each item in their basket roughly in accordance with its expenditure share. That is, the more households spend on an item, like rent, the higher the weight it receives in the overall index. The weights are broadly similar across the two indexes, but, again, there are some important differences.
- “First, the PCE price index has a broader scope than the CPI. The CPI is limited to expenditures that households pay out of pocket, while the PCE price index covers a broader set of goods and services as it seeks to cover prices for all consumer expenditures in the national income and product accounts (NIPA). For example, the PCE price index includes prices of the health services provided to households through Medicaid, while the CPI excludes these items.
- “Second, the PCE price index and the CPI use different weighting systems. The PCE price index, which is more comprehensive than the CPI, estimates expenditure shares using the national income and product accounts, while the CPI measures expenditure shares using a separate survey of households, the Consumer Expenditure Survey. This leads to some differences in expenditure weights that can at times be important.
- “For example, the share of medical services is notably higher in the PCE price index (partly because the PCE price index includes more kinds of medical expenditures), and the share of housing services is noticeably smaller (because overall expenditures are larger in the PCE price index). As a result, when health-care services or housing services inflation behave differently than other prices, this can lead to differences in PCE versus CPI inflation.
- “Another difference in the weights is that the PCE price index uses time-varying weights, while the official CPI keeps weights fixed for a year. The PCE price index weights change to reflect changes in the goods consumers buy. For instance, at the start of the pandemic, the CPI was still giving the same weights to cruise ship and airline fares, even though no one was traveling.
- “The time-varying weights in PCE also account for substitution behavior. Suppose the price of apples goes up and the price of oranges stays the same. Consumers are then likely to substitute apples with oranges.
- “In contrast, the CPI does not capture substitution behavior because the basket of goods consumers purchase is updated only once a year (instead of every month) and reflects expenditure patterns prevailing two years ago.
- “The substitution effects captured by the PCE price index is one reason why PCE inflation (black line) is, almost always, lower than CPI inflation (red line), as you can see in Chart I.
Chart I
PCE and CPI Inflation
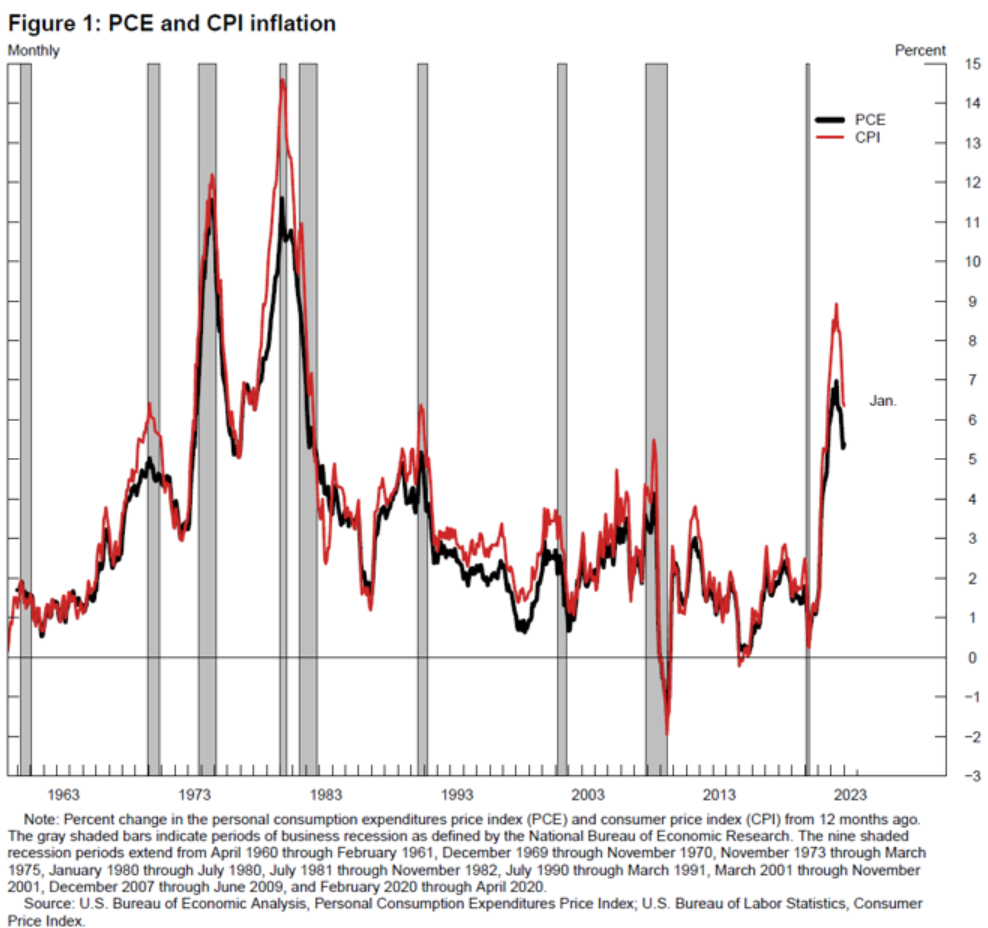
Chart source: Federal Reserve
- “As I mentioned earlier, there are both total and core PCE price and CPI indexes. The core subindex is the total index excluding food and energy prices. Food and energy prices are more volatile than other prices, which makes total inflation more volatile.
- “This volatility is evident in Chart II. You can see the black line (total PCE price index) exhibiting more drastic ups and downs than core PCE price index, the red line in the graph, and many of the sharp movements are short lived. In other words, the volatility in the total PCE price index makes it harder to discern trends (longer-lasting movements) from transitory movements.
- “In addition, food and energy prices often depend on factors that are beyond the influence of monetary policy, such as geopolitical developments (for example, those associated with fluctuations in energy prices) or weather or disease or war (for example, in the case of food prices).
Chart II
PCE and Core PCE Inflation
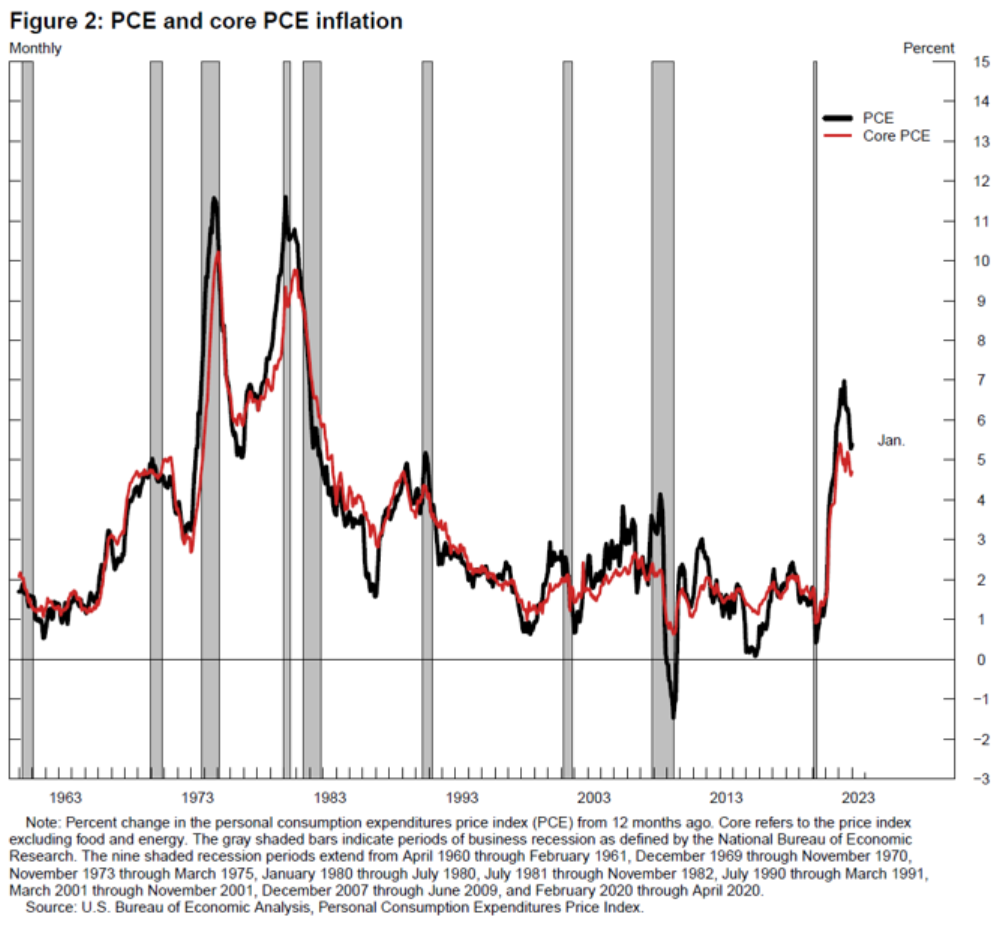
Chart source: Federal Reserve
- “In summary, the differences between CPI and PCE price indexes are important. The FOMC has chosen to target the PCE price index because it is broader, and it captures more accurately what households are actually consuming. In addition, food and energy account for a significant portion of household budgets, so the Federal Reserve’s inflation objective is defined in terms of the total PCE price index, but the Fed monitors the core PCE price index, as well as other inflation indicators, in order to identify evolving inflation trends.”
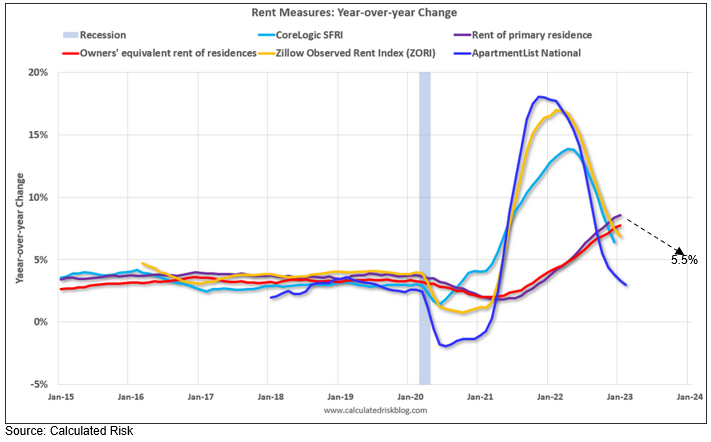
Costs of Housing
The costs of housing are rising about 8% a year in both indexes, a four-decade high, the lagged effect of booming demand for houses and apartments owing to low interest rates and remote working during the pandemic.1
Housing makes up around 33% of CPI, more than twice its share in PCE. That means the current strength in housing costs is pushing up CPI more, contributing 2.5 percentage points to January’s 6.4% rise in CPI, compared with 1.2 percentage point in the 5.4% rise in January’s PCE price index.1
But that dynamic is set to reverse. CPI shelter inflation is expected to fall from 8.1% in March to 5.5% by December. Because of the differences in weighting, such a reversal will likely exert a bigger drag on the CPI than on the PCE price index.1 (See Chart III)
Chart III
Rent Measures Year-Over-Year
The Sticky Problem
The Fed funds rate needs to remain higher for longer until core PCE services less housing declines to a rate of 2.5% or less. PCE services, excluding food, energy and housing, reflects underlying wage inflation, which rose from a plateau of 2% during the period 2017 to 2020, to over 4% from 2021 to date.
Chairman Powell’s favorite measure of core PCE less housing is believed to be very wage-dependent and includes everything “from healthcare to haircuts.”2 This category increased 0.6% month-to-month in January, or at an annual rate of 7.2%. This was the second month of acceleration, increasing the year-over-year rate to 4.7% (see Chart IV).
Chart IV
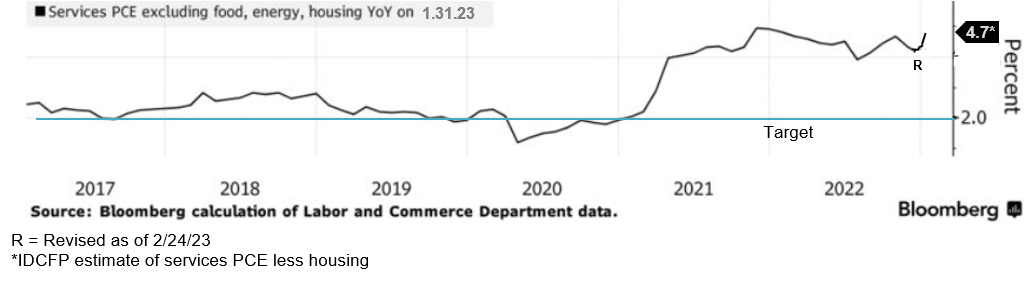
At the start of 2023, income rose 0.6%, bolstered by wage growth acceleration and this increase was reflected in a higher core PCE services less housing inflation.
Wage Growth
Hourly compensation increased at a 4.9% pace in the fourth quarter of 2022, instead of a 4.1% rate as previously reported. It rose at an 8.2% rate in the third quarter and grew at a 4.4% rate compared to the fourth quarter of 2021.3
Economists polled by Reuters had forecast labor costs being revised up to a 1.6% growth pace. Unit labor costs rose at a 6.3% rate from a year ago, revised up from the previously reported 4.5% pace.3
They surged 6.5% in 2022, instead of 5.7% as reported last month, too fast to be consistent with the Federal Reserve's 2% inflation target. Labor market tightness and stubbornly high inflation have stoked fears that the Fed could continue raising interest rates into summer.3
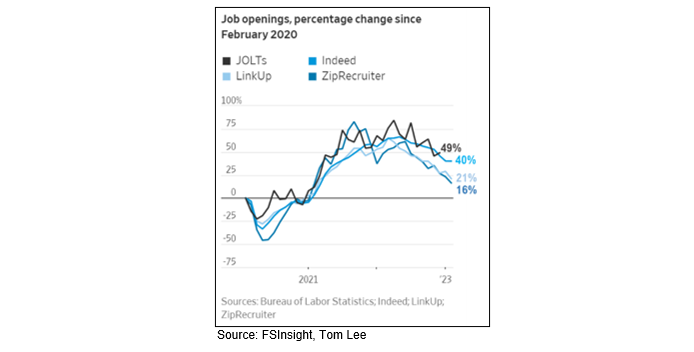
Wage growth accelerated in 2022 as Jolts and other job openings surveys accelerated above zero. Wage growth decelerates to the 2% range when Jolts, led by other employment surveys, approach zero in 2024 (see Chart V).
Chart V
Conclusion
Stubborn inflation coupled with resilient spending suggests the Fed’s road to tamed prices and demand will be longer and bumpier than expected, and negates what data in late 2022 indicated. While Fed rates rise toward 6% and time at these higher rates is extended, risk of recession increases. The Fed funds rate remains high until a major recession sharply increases unemployment or the core PCE services less housing inflation rate declines to 2.5% or less.
1 Fed Might Be Winning Inflation Fight, Depending on Index Used, WSJ, 03/02/2023
2 Jerome Powell’s Worst Fear Could Come True in Southern Job Market, Bloomberg, 02/23/23
3 US fourth-quarter labor costs revised higher;, Reuters, 03/02/2023
To view all our products and services please visit our website www.idcfp.com. For a copy of this article, please contact us at 800-525-5457 or info@idcfp.com.
John E Rickmeier, CFA
President
jer@idcfp.com
Robin Rickmeier
Marketing Director