Inflation Drops to 6%, But Housing Remains High, Fed Still Watching ‘Supercore’ Inflation
Supercore, Services Less Rent of Shelter, Inflation Remains Elevated
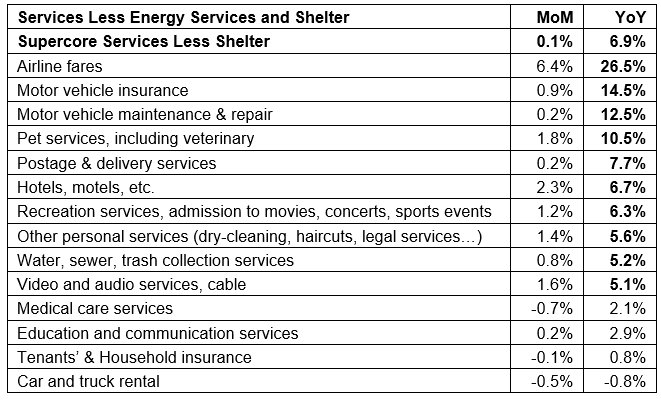
Even with year-over-year inflation moving closer to the Fed’s target benchmark rate of 2%, the cost of services has become a growing share of overall inflation in recent months, and the central bank is closely monitoring so-called supercore inflation.1
Table I
Housing costs are excluded from supercore inflation because of the lag in how shelter prices are measured by the CPI. Plus, the Fed expects shelter prices to cool off long-term, which would make them less of a factor when it comes to rising inflation. Likewise, volatile food and energy prices are excluded. 1
“In the housing services sector we expect inflation to continue moving up for a while but then to come down, assuming that new leases continue to be lower,” Fed chair Jerome Powell said in an early February statement. 1
Since the cost of services are driven largely by wages, rising service costs could keep inflation elevated above 2% for many months to come, in what’s known as “sticky” inflation. 1
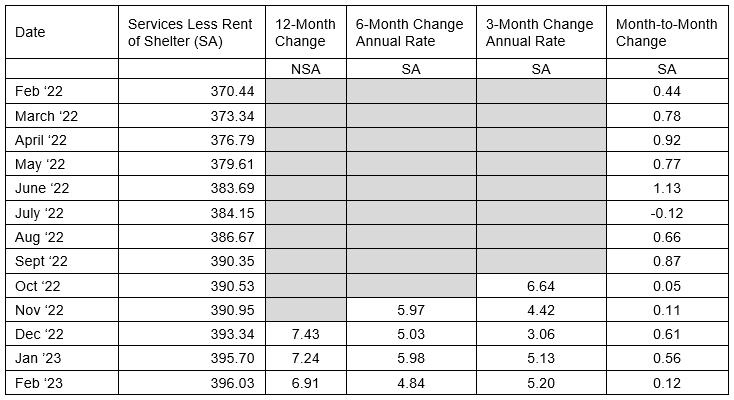
Powell’s preferred rate of inflation is Supercore CPI, which equals services less rent of shelter. Supercore, attempting to capture the underlying wage pressure on prices of non-housing consumer services, rose 1.4% last month, 5.2% over 3 months and 4.8% over 6 months at annual rates. Super core remains a problem with an expected 5% level for 2023.
Table I
Fed Chairman Powell’s Last Core CPI Major Component Still with Inflation, Service Less Rent of Shelter Progress on the Soft Landing Front2
A softening in average hourly earnings is helping fuel hopes for a soft landing. At 0.2% on the month, wage growth was below expectations and measured 4.6% year over year.2
"There were signs in today's report that progress on inflation can be made without torpedoing employment," the Wells Fargo economists noted. 2
As of February, the annualized rate of wage growth during the past three months is slightly under 3.6%, a pace seen when inflation was below the Fed's target, said economist Dean Baker, co-founder of the Center for Economic and Policy Research. 2
"Perhaps most important from the Fed's perspective is the slowdown in wage growth," Baker wrote in a statement. "The 3.6% annual rate over the last three months can hardly be seen as posing a serious threat of inflation. This slowing in the average hourly wage, coupled with the 4% rate reported in the fourth quarter Employment Cost Index, should provide solid evidence that wage growth has slowed sharply." 2
Disinflation Coming in Housing
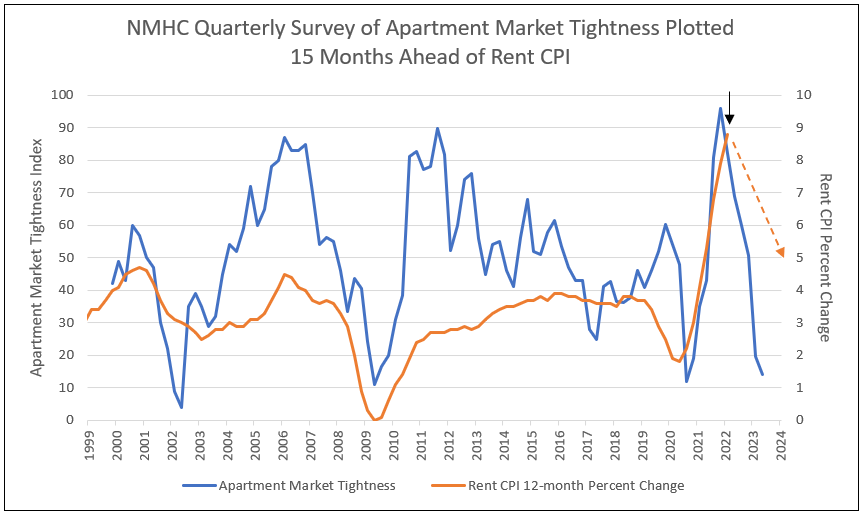
Shelter or housing inflation reached a peak in December 2022 at a 9.6% annual rate and declined to 7.9% in January. Plotted with the National Multifamily Housing Council Index for rent and vacancies, plotted forward 15 months, forecasts a sudden and sharp decline in Rent and OER CPI in the coming months toward 2%. Powell referred to the event as “coming deflation in housing.”
Chart I
Huge Disinflation Coming in Rent CPI
The CPI for Housing as a Service
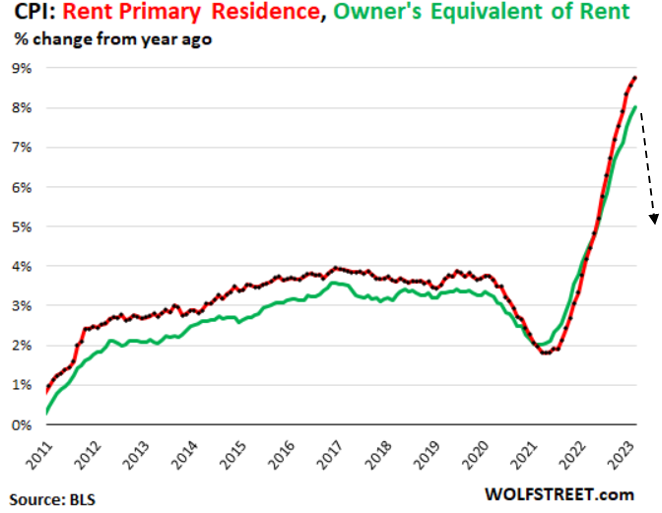
The CPI for housing as a service – “rent of shelter” – which in February weighed 34% of total CPI, is based on rent factors, primarily “Rent of primary residence” (weight: 7.5% of total CPI) and “Owner’s equivalent rent of residences” (weight: 25.4% of total CPI).3
“Rent of primary residence” tracks actual rents paid by tenants in houses and apartments, including rent-controlled units. The survey follows the same large group of housing units over time and tracks what tenants are actually paying in these units. So, this reflects actual rents paid by tenants. 3
Not “asking rents.” Other rent indices, such as the Zillow rent index, track “asking rents,” which are advertised rents of still vacant units on the rental market. When asking rents are too high to fill the units, landlords may lower the asking rent. There was a boom in asking rents during the pandemic. But rentals don’t turn over that much, and proportionately not many people actually ended up paying those asking rents. 3
“Owner’s equivalent rent of residences” tracks the costs of home ownership as a service, based on what a large panel of homeowners report their home would rent for. 3
Both rent factors jumped: 3
- Rent of primary residence: +0.8% for the month, + 8.8% year-over-year, worst since 1982 (red, Chart II)
- Owner’s equivalent +0.7% for the month, +7.8% year-over-year, worst in the data (green, Chart II)
Chart II
The Health Insurance Mega-Downward Adjustment as a Part of “Medical Care Services”3
BLS undertakes annual adjustments in how it estimates the costs of health insurance, which is based on the change in retained earnings of insurance companies that provide health insurance. Then BLS spreads those adjustments over the following 12 months. The first mega-adjustment hit in October and every month since (more details on that here).3
In other words, for the 12 months through September 2022, CPI overestimated health insurance inflation (+28% YOY in September 2022), and it now corrects for this overestimation by spreading the massive adjustment over 12 months through September 2023. Without that mega-downward adjustment, services CPI would have been even worse for the past four months. 3
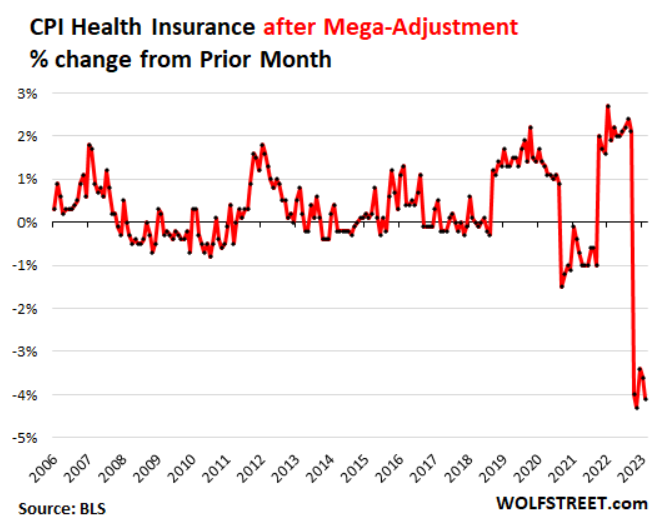
Due to this downward adjustment, the CPI for health insurance plunged by 4.1% in February from January. The five months of mega-adjustments reduced the year-over-year rate of the CPI for health insurance from the pre-adjustment +28% in September to -4.7% in February. 3
The PCE price index, to be released later in March and which the Fed prefers, figures health insurance inflation differently and has had no adjustments in computing PCE prices. Therefore, PCE price index, services inflation has been aggressive. 3
Following is a chart of the month-to-month changes of the health insurance CPI after the adjustments.
Chart III
Disinflation and Deflation in Goods Prices
Commodities less food and energy rose only 1.4% for the 12 months ending January 2023. The modest increase was limited due to deflation, or decline, in used cars and trucks prices of 11.6%.
Apparel rebounded in January, up 0.8% versus only 0.2% in December. Medical commodities rose 1.1% in January, while December was up 0.1%. Tobacco products were up 0.7%, compared to a negative 0.1% in December. Conversely, new vehicle prices rose only 0.2%, versus a 0.6% rise in December, and alcoholic beverage prices were up 0.4% versus a 0.7% increase the previous month.
With the used car price index at auction (Manheim index) increasing in 2023, the negative pull of used car prices in the CPI might be at an end.
The Producers Price Index continues to deflate, forecasting continued decline in goods prices (see Chart IV).
Chart IV
Durable Goods CPI in Deflation Due to Negative Growth in Used Car Prices

Conclusion
- The liquidation of three west coast banks with high risks in loans and investments, coupled with excess uninsured deposits were justified.
- The liquidation events, however, created a banking crisis of fear of loss of uninsured deposits at regional banks.
- The swap market in Fed funds indicated a 25-basis point increase in March, followed by up to 4 reductions in the Fed funds rate later this year.
- Given the decline in yield or higher prices for long term Treasuries, the bank losses on securities held to maturity peaked and declined.
- Therefore, Fed funds under 5%, but for longer, remains a strong possibility.
1 Inflation drops to 6%, but housing costs remain high— cnbc.com, March 14, 2023
2 Takeaways from the February Jobs Report cnn.com, March 11, 2023
3 Services Inflation Rages at Four-Decade High: Fueled by Rents,... Wolf Street, March 14, 2023
To view all our products and services please visit our website www.idcfp.com. For a copy of this article, please contact us at 800-525-5457 or info@idcfp.com.
John E Rickmeier, CFA
President
jer@idcfp.com
Robin Rickmeier
Marketing Director