Analysis of Bank Risk Liquidity
Part I: IDCFP’s Approach to Bank Risk Liquidity
IDC Financial Publishing (IDCFP) examines another two measures of risk. One is uninsured deposits, borrowing and other liabilities as a percent of the market value of assets available for liquidation. Uninsured deposits are normally used in risk analysis. Borrowings are often secured by securities held to maturity. Other liabilities are an offset to assets held like trading assets or Fed funds sold or securities purchased under agreement to resell. Market value of assets available for liquidation include interest bearing cash balances, all securities at market, Fed funds sold, and securities purchased under agreements to resell, loans held for sale, and trading assets.
The second measure of risk is unrealized loss on fixed income securities held to maturity as a percent of tangible common equity capital.
Two Ratios Explain the Silicon Valley Bank Liquidation
According to financials for all banks as of December 31, 2022, most banks over $50 billion have similar percentages of uninsured liabilities to the market value of assets for liquidation of over 100%. While these banks are vulnerable, uninsured depositors are the key to risk to a bank. Given operations, financials, and bank risks are normal, uninsured depositors may not choose to request redemption of deposits. These banks are not in the venture capital financing area like Silicon Valley Bank.
Silicon Valley Bank (based in CA) failed with uninsured liabilities at 158% of the market value of assets available for liquidation. Signature Bank (based in NY) failed with uninsured liabilities equal to 278% of the market value of assets available for liquidation. Both banks had uninsured deposits at 72% of assets, the highest among all banks. The vast majority of banks had this percentage less than 50%. The above data is from December 31, 2022 bank filings.
The excess of uninsured liabilities as a percent of market assets available for liquidation are meaningful, given the unrealized loss of securities held to maturity are a significant percentage of tangible common equity capital (see below).
As an example, below is the history of Silicon National Bank in terms of these two ratios:
Table I
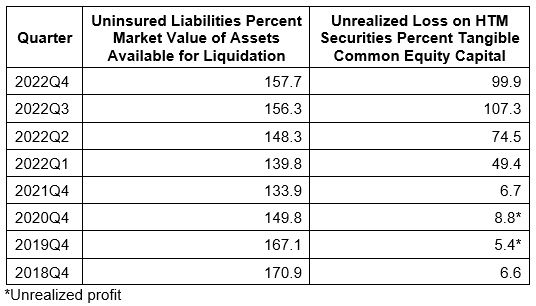
For years, Silicon Valley Bank had an excess of uninsured liabilities as a percent of the market value of assets available for liquidation. During 2022, a year of increases in the Fed funds rate, yields rose, and prices declined on fixed income securities held to maturity (HTM). The unrealized loss on HTM securities as a percent of tangible common equity capital rose from near zero in 2020-2021 to over 100% by the third quarter of 2022.
IDCFP is adding a rank change to reflect these two ratios. The rank change reflects the percentage of uninsured liabilities to market value of assets for liquidation above 100%, times the ratio of unrealized loss on HTM securities to tangible common equity.
Silicon Valley Bank with a rank of 276 as of fourth quarter 2022 reported data, was reduced to 118. This rank change reduced ranks in another 5 banks from 125 and over to less than 125 (below investment grade). An additional 126 banks had a rank reduction of more than 20 points but remained above 125.
This demonstrates the limited impact of the current banking liquidity crisis on the safety and soundness of banks.
The risks in the current financial crisis are caused by uninsured deposits and the loss on fixed income securities all relative to assets and tangible capital. To assist in mitigating the problem, the Federal government could 1) insure all deposits, 2) raise the insured deposit level above $250,000 or 3) inflation declines and/or a recession could result in a significant decline in the Fed funds rate and a fall in longer-term Treasury yields (rising prices of held to maturity securities) sharply reducing the risk to tangible capital. That would be the reverse of the events that led up to the collapse of Silicon Valley Bank (see Table).
Finally, the new borrowing facility at the Fed (BTFB) allows banks to borrow at par value against the securities held to maturity. Given the last increase in the Fed funds rate, the cost of borrowing is expensive at 5%. Yet, the new BTFB rose by $42 billion in the last week (from $12 billion to $54 billion).
Part II: Summary of SSRN paper “Monetary Tightening and U.S. Bank Fragility in 2023: Mark-to-Market Losses and Uninsured Depositor Runs?”1
The authors of this paper analyze U.S. banks’ asset exposure to a recent rise in the interest rates with implications for financial stability. The U.S. banking system’s market value of assets is $2 trillion lower than suggested by their book value of assets accounting for loan portfolios held to maturity. Marked-to-market bank assets have declined by an average of 10% across all the banks, with the bottom 5th percentile experiencing a decline of 20%.
They illustrate that uninsured leverage (i.e., Uninsured Debt/Assets) is the key to understanding whether these losses would lead to some banks in the U.S. becoming insolvent-- unlike insured depositors, uninsured depositors stand to lose a part of their deposits if the bank fails, potentially giving them incentives to run.
Recently failed Silicon Valley Bank (SVB) is a case study of this. 10 percent of banks have larger unrecognized losses than those at SVB, and SVB was not the worst capitalized bank, with 10 percent of banks having lower capitalization. But SVB had a disproportional share of uninsured funding compared to only 1 percent of banks having higher uninsured leverage. Combined, losses and uninsured leverage provide incentives for an SVB uninsured depositor run.
When central banks tighten monetary policy, it can have significant negative impact on the value of long-term assets. It can create losses for banks, which engage in maturity transformation and finance long maturity assets with short-term liabilities or deposits. As interest rates rise, the value of a bank's assets can decline, potentially leading to bank failure through two broad, but related channels. First, if a bank's liabilities exceed the value of its assets, it may become insolvent. Second, uninsured depositors may become concerned about potential losses and withdraw their funds, causing a run on the bank.
Uninsured depositors are a significant source of funding for commercial banks, accounting for about $9 trillion dollars of their liabilities, making runs a significant risk for these institutions. During the 1980s and 1990s, nearly one-third of savings and loan institutions failed due to losses incurred from long-term fixed-rate mortgages that declined in value when interest rates surged. Recently, the largest bank failure since the great recession occurred on March 10, 2023, when Silicon Valley Bank (SVB) was taken into FDIC receivership. 92.5% of its deposits were uninsured, leading to significant withdrawals that ultimately resulted in the bank's collapse.
The Federal Reserve Bank responded to high inflation by increasing interest rates, which resulted in a substantial decline in the market value of long-duration assets. From March 7, 2022, to March 22, 2023, the federal funds rate rose sharply from 0.08% to 4.82%. This increase was accompanied by quantitative tightening. As a result, long-dated assets like those held on bank balance sheets, experienced significant value declines. It is evident that the FED's monetary policy tightening caused significant value declines in long duration assets.
The authors used bank call report data capturing asset and liability composition of all US banks (over 4,800 institutions) combined with market-level prices of long-duration assets to assess the financial stability of U.S. banks.
- First, they examined losses on banks' assets including their loan portfolios held to maturity, which have not been marked-to-market, as well as securities linked to real estate, commercial mortgage-backed securities, US Treasuries, and other asset-backed securities. These assets comprise more than half of bank assets (72% of $24 trillion dollars). Adjusting these assets to their market values found that bank assets decline on average by 10% to 20%.
- Next, they looked at how the decline in assets impacts the solvency and run incentives of banks, by assessing banks' funding structures before the recent monetary tightening. In this analysis they found SVB’s bank liabilities were more prone to runs than those of other banks.
- Finally, they analyzed several scenarios that combine the analysis of declines in marked-to-market asset values, along with banks’ capitalization and uninsured leverage.
“Distribution of Change in Equity Value”
Figure I shows the histograms of equity to asset ratios plotted, calculated based on 2022Q1 balance sheets and mark-to-market values using various ETFs and indices (Panel a) and equity to asset ratio against bank size (Panel b). The reference lines in Panel (a) indicate Silicon Valley Bank’s (SVB) values. SVB’s equity to asset ratio is 6.7% based on its 2022Q1 balance sheet and its equity to mark-to-market asset ratio is -10.7%.
Figure I
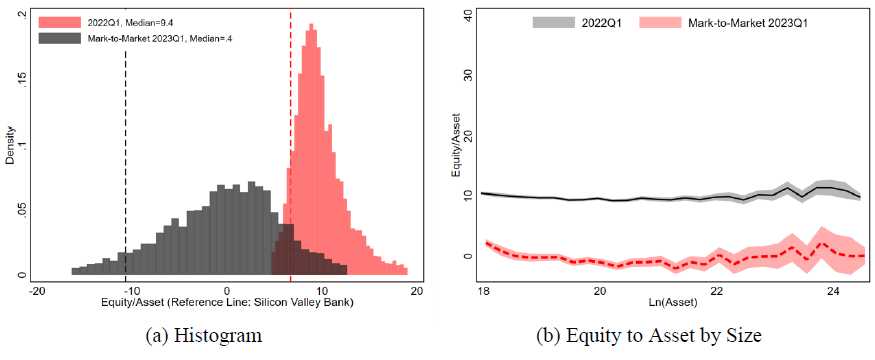
Data Sources: Bank Call reports and various ETF and indices price data.
1 Monetary Tightening and U.S. Bank Fragility in 2023 SSRN paper written March 13, 2023
To view IDCFP's products and services please visit our website www.idcfp.com. For a copy of this article, please contact us at 800-525-5457 or info@idcfp.com.
John E Rickmeier, CFA
President
jer@idcfp.com
Robin Rickmeier
Marketing Director