Core Services Ex Housing PCE Remains Sticky and Threatens Banking System
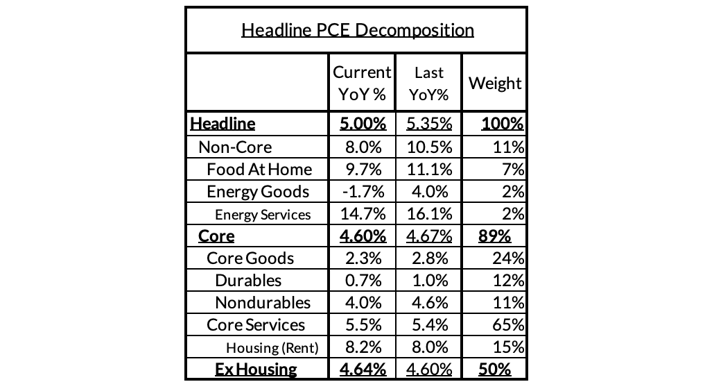
February’s growth rate in the Fed’s favorite gauge of inflation, “Core Services Ex Housing PCE” is expected to remain at 4.6% well into 2023, 190-basis points above the 2.7% required run rate in the aggregate that coincides with the 2% headline and core PCE target of the Federal Reserve.
Table I
Source: Employ America
Core Services Ex Housing is the main contributor to ongoing core PCE inflation, illustrated in Chart I below. While the housing component is currently at 8%, it is expected to recede to 5% by year-end 2023. Core PCE will continue to inflate at 4.6% at an annual rate in the coming months.
As calculated by Employ America, February monthly core PCE surprised forecasters. and came in at 0.27%. There are potential signs of encouragement for the Fed in this report, relative to what CPI and PPI revealed. There are tentative signs that higher deposit rates and slower wage growth are feeding into slower growth for imputed financial services and input cost index inputs to PCE (which are based on idiosyncratic labor compensation data). These components are the "dark spaces" of PCE where there is no kind of direct read beforehand (and where the methodology is most opaque).1
- Headline PCE fell, from 5.35%* year-over-year in January to 5.00% in February (a 0.26% month-over-month increase). January year-over-year was revised down 3bps from 5.38%.1
- Core PCE fell, from 4.67%* year-over-year in January to 4.60% in February (a 0.30% month-over-month increase). January year-over-year was revised down 3bps from 4.70%.1
- Core Services Ex Housing PCE stayed flat, but decelerated in month-over-month terms. Year-over-year readings rose from 4.60%* year-over-year in January to 4.64% in February (a 0.27% month-over month increase). January year-over-year readings were revised down from 4.66%. Imputed financial services and input-cost compensation-based indices drove the reduction in the month-over-month reading (see below Table II and Charts II & III).1
Chart I
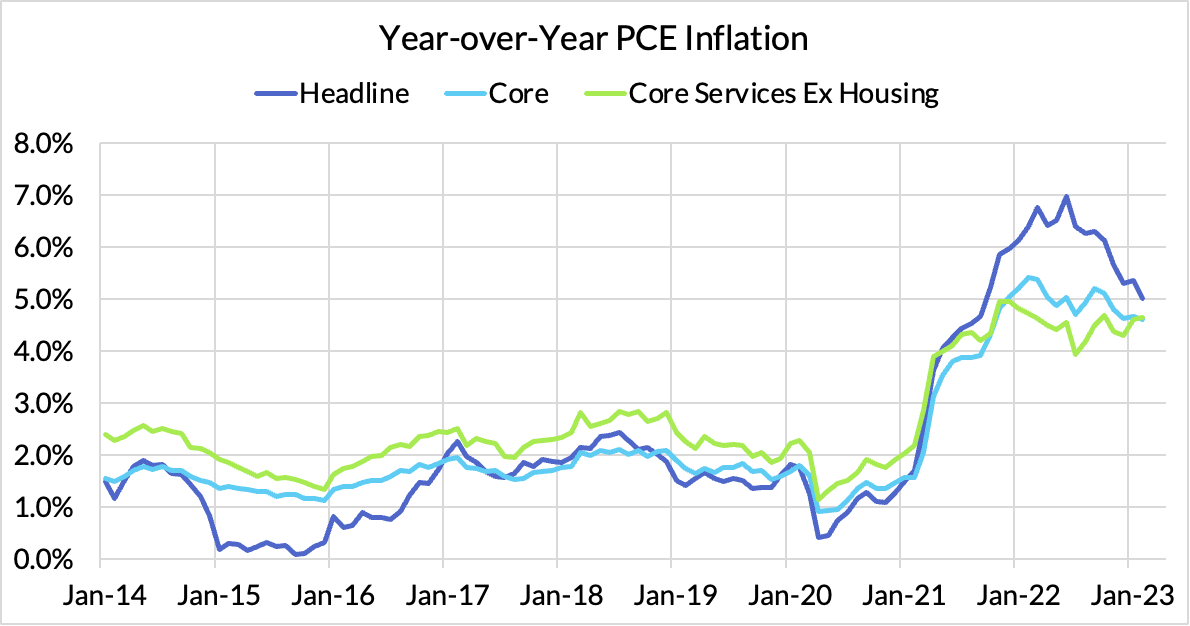
Source: Employ America
Breakdown of Key Elements of Core Services Ex Housing PCE
Select large changes in month-to-month versus year-to-year inflation contributions offset in the calculation of Core Services Ex Housing PCE.
Table II
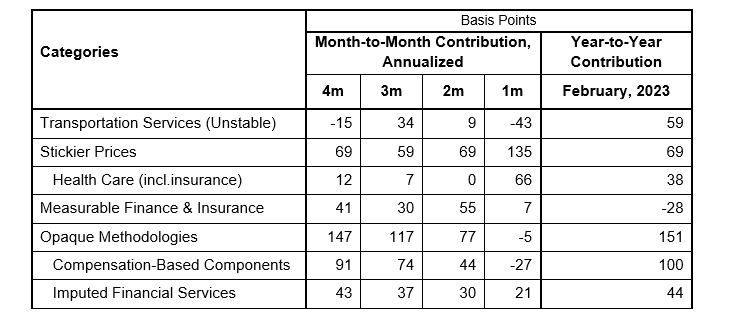
Source: Federal Reserve
Transportation services (airfares) are unstable and future contributions are difficult to predict. Inflation related to financial management and insurance seems to be moderating. Compensation-based components (12.5% of PCE) are also moderating.
The Dark Spaces of PCE1
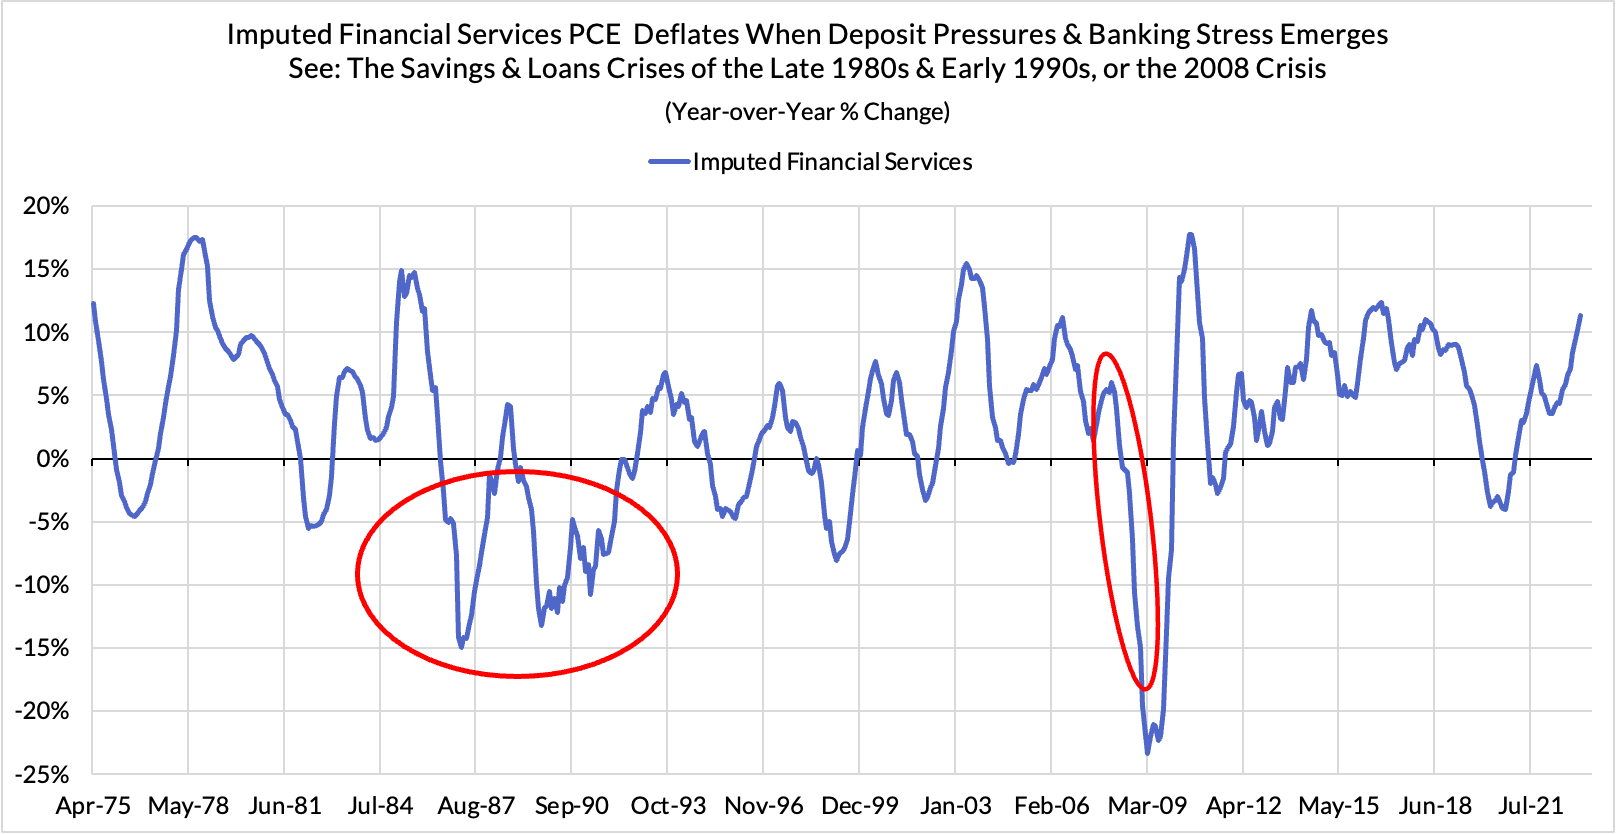
Dark Space 1: The scramble for deposits is creating downside potential1
Upward pressures on deposit rates (relative to the Fed Funds Rate) can create deflationary potential. The less that depositors are losing on their deposit rates relative the Federal Funds Rate, the “cheaper” the bundle of imputed financial services that the Bureau of Economic Analysis assumes depositors are implicitly paying for. This single component could shave off as much as 40 basis points on core PCE and 70 basis points on Core Services Ex Housing PCE if deposit rate pressures continue to ratchet up.1 Even with a 70-basis point reduction, the core PCE would still remain above 4%.
Dark Space 2: The decelerating wage data is starting to show up where it counts1
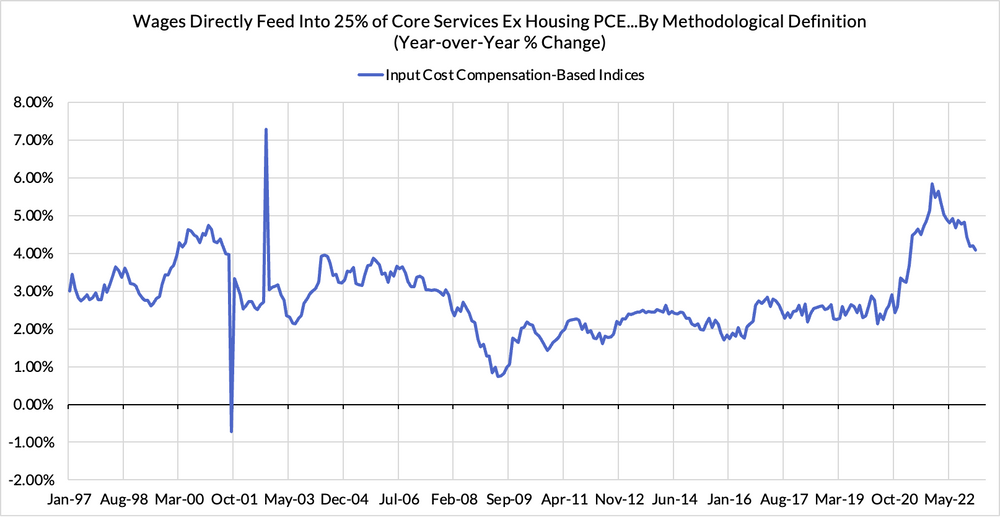
We are very skeptical of the Fed’s claims that Core Services Ex Housing PCE is driven by wage growth in a macro-causal sense. The empirical evidence does not match the Fed’s presumptive claims, unless you use the special compensation series designed by the White House economists. But there is a quarter of Core Services Ex Housing that uses wage and compensation data as the direct input for tracking “prices.” 12.5% of the total PCE basket is measured not by market prices for consumption, but by input-cost compensation-based indices. These two are starting to show (with some help from revisions) meaningful slowing.1
Chart II
Source: Employ America
Chart III
Source: Employ America
Conclusion
- Core Services Ex Housing inflation remaining at 4.6%, coupled with a 3.3% U.S. 10-year yield, forecasts stagflation with a moderate recession. The best forecast for the aggregate by year-end is 3.8%, still well above the 2.7% required rate.
- The high underlying Core Services Ex Housing inflation at 4.6%, or even 3.8%, requires the Federal Reserve to maintain the Fed funds rate close to 5%.
- For banks, the reduced 10-year yield limits lending rates, while the 5% Fed Funds rate, 4.8% Fed reverse repo rate and high 2-year yield lift deposit costs or cause deposit runoff. In addition, a recession raises the prospect for higher loan delinquencies. All of the above are unfavorable for banking, but that is why the regional banks sell at a price to earnings ratio of 6.3-times estimated earnings per share, a record low on March 15, compared to a normal P/E of 12 or higher.
Chart IV
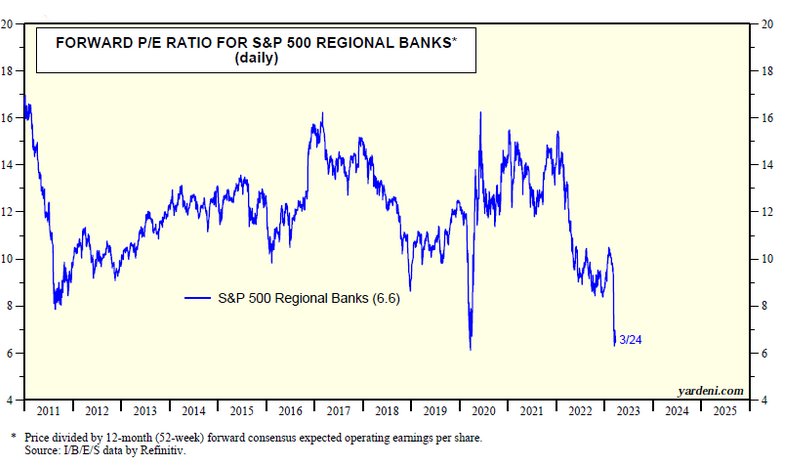
Source: Yardeni Research, Inc.
1 February Core-Cast Post-PCE: The Dark Spaces Show Some Dovish Potential, Employ America, 03/31/2023
To view all our products and services please visit our website www.idcfp.com. For a copy of this article, please contact us at 800-525-5457 or info@idcfp.com.
John E Rickmeier, CFA
President
jer@idcfp.com
Robin Rickmeier
Marketing Director