Fed Funds Rate Hikes and High Two-Year Yields Forecast Significant Increases in Brokered CDs
Brokered CDs Reaching New Highs in 2024
Deposit costs at banks reflect competition from yields on the 3-month T-Bill near 5%, and the 2-year at 4%, coupled with the upward pressure of another potential 25-basis point hike in the Fed funds rate in May. Together, these yields forecast rising deposit costs for banks. One method of increasing deposits or replacing deposit runoff is to issue brokered CDs of $250,000 or less, which are fully insured by the FDIC.
IDC Financial Publishing (IDCFP) has attempted over time to estimate brokered CDs for individual banks. The unknown in the equation has historically been the level of sweep accounts in brokered deposits. As of September 30, 2021, bank reports, sweep accounts for individual banks were available on the call reports.
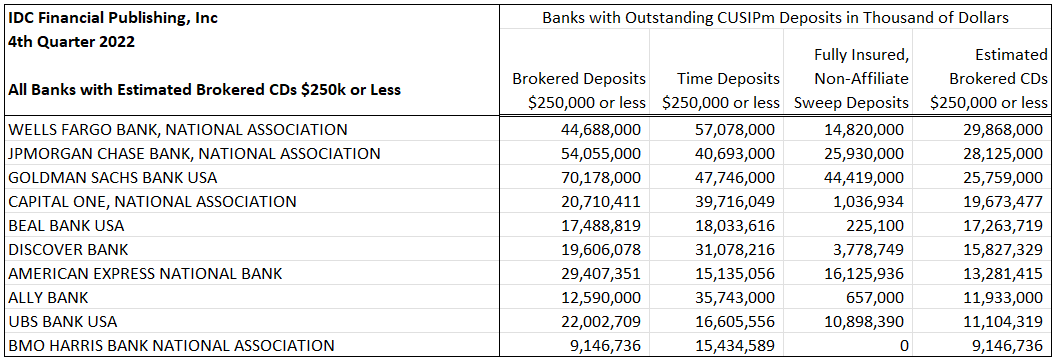
As of December 31, 2022, the IDCFP estimate of brokered CDs $250,000 or less as a sum of all banks was $409.5 billion compared to DTC value of $458.9 billion. The latter includes credit unions and a few foreign banks. IDCFP calculates the estimate, shown in Table II, by subtracting from the brokered deposits of $250,000 or less from the fully insured sweep deposits, capped at the value of time deposits of $250,000 or less for banks with an outstanding CUSIP number for brokered CD issuance. IDCFP concludes the estimates for individual banks’ brokered CDs is reasonably accurate and available on request for your own marketing or other research needs.
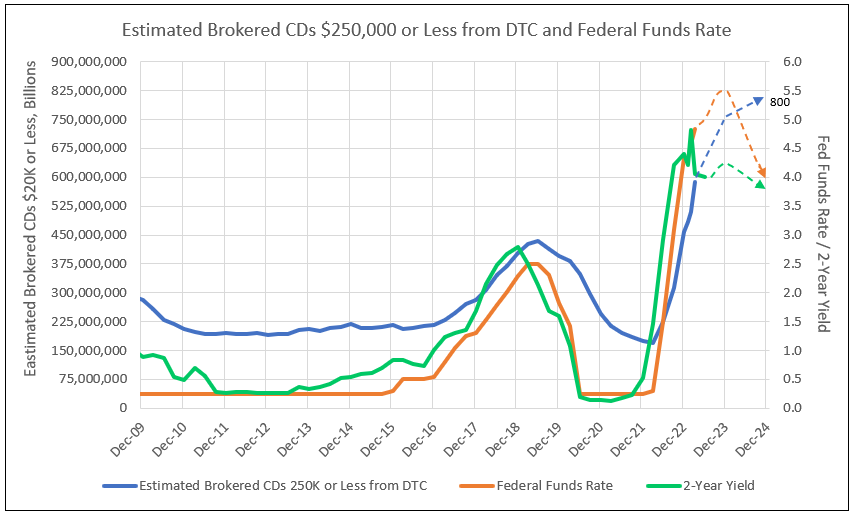
DTC Brokered CDs of $250,000 or less peaked in June 2019 at $433.3 billion and declined to $395.6 billion by December 31, 2019. The significant decline in 2020 was due to Covid and the actions of the Federal Reserve Bank to increase liquidity by adding Treasuries and mortgages to its balance sheet.
The average rate of decline in DTC reported brokered CDs was $15.2 billion a month in the last three quarters of 2020, and then fell to $8.4 billion a month in the first half of 2021, then narrowed to $3.5 billion a month in 2021Q3, and then $2.8 billion a month in the fourth quarter of 2021. From year-end 2021 to the end of February 2022 balances declined $3.2 billion a month. However, DTC balances rose from $169.4 billion in February 2022 to $224.3 billion in June, to $312.6 billion in September, and accelerated to $458.9 billion in December. As of March, 2023 the DTC balance surged to $586.6 billion.
Brokered CDs began increasing at an accelerated pace in February 2022 and continued through March 2023. IDCFP projects brokered CDs of $250,000 or less to increase $163 billion in the remainder of 2023 to a year-end balance of $750 billion. An additional increase of $50 billion is expected by year-end 2024, raising the balance to $800 billion.
Sticky Core Services Ex Housing PCE Maintains High Yields on Treasuries
Despite a seemingly encouraging March CPI release, March PCE readings showed some upside through PPI revisions to the last 4 months and a strong set of numbers in healthcare services.1 The inflation outlook is more favorable toward year-end. But headed into the May FOMC meeting, Core Services Ex Housing PCE remains sticky at 4.5% and the Fed funds rate is expected to be raised by 25 basis points in May.
Employ America: March PCE Core-Cast, Post-CPI & PPI1
Most of the Personal Consumption Expenditures (PCE) inflation gauges are sourced from the Consumer Price Index (CPI) data, but Producer Price Index (PPI) input data is of increasing relevance. There are also some high-leverage components that only come out on the day of the PCE release.1
Table I
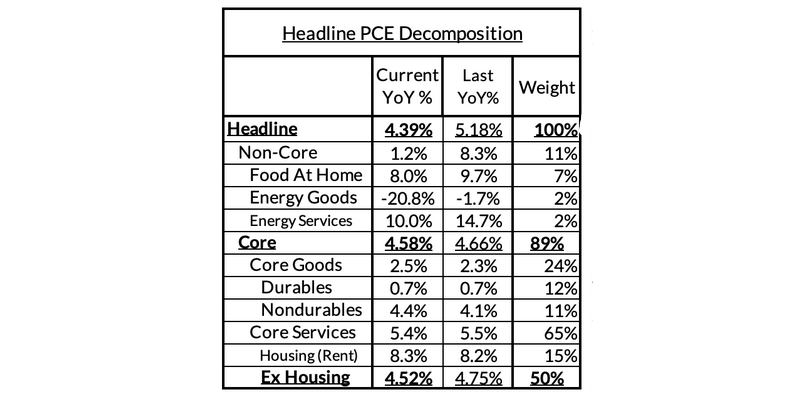
Source: Employ America, as of April 14, 2023
The economy continues to increase in the first half of 2023 with a sticky 4.5% inflation rate, as measured by Core Services Ex Housing PCE. A soft landing or moderate recession later in 2023 reduces this inflation rate to 3.9% by year-end, but remains well above the required 2.7% run rate for this inflation aggregate, given the Fed target for Core PCE of 2.0%.
The Fed funds rate is maintained over 5%, T-Bill yields remain high and the 2-year T-Note yield continues above 4%. ALL these yields are competitive to bank deposit rates, requiring issuance of brokered CDs.
Brokered CDs outstanding bottomed in 2022 and are expected to reach $750 billion by the end of this year, and $800 billion by year-end 2024 (see Chart I).
Chart I
Brokered CDs $250,000 or Less Estimated to Reach New High in 2023 and Grow to $800 Billion by 2024
IDCFP has estimates of brokered CDs $250,000 or less outstanding for each issuing bank, available on request. See below a sample list of banks.
Table II
1 - March Core-Cast Post-CPI & PPI: Encouraging CPI Swamped By Discouraging Healthcare PPI Details, Employ America, April 14, 2023
To view all our products and services please visit our website www.idcfp.com. For more information on banks with brokered CDs outstanding, and the amount of these CDs, or for a copy of this article, please contact us at 800-525-5457 or info@idcfp.com.
John E Rickmeier, CFA
President
jer@idcfp.com
Robin Rickmeier
Marketing Director