Growth Slows in Credit Unions, Plus Shifts in the Balance Sheet
Credit unions have grown to become a major factor in the U.S. economy, with assets that have grown at nearly twice the pace of banks over the past decade. Credit unions are owned by their members and are designed to offer lower borrowing costs and higher deposit rates. In addition, the median large credit union (greater than $50 million in assets) earned a return on equity (shares and reserves) of 9.4% and experienced 11% loan growth over the past year.
IDC Financial Publishing (IDCFP) focuses on 2,483 credit unions with $50 million or more in assets to determine the risks to the financial system. These larger institutions are using their strength to compete aggressively for business. The 2,304 credit unions with assets less than $50 million remain important to the industry, but are not a major risk factor in a potential economic downturn or the overall health of our financial system.
Reduced Risk in Large Credit Unions
IDCFP calculated the CAMEL rating of 4,787 credit unions in the second quarter of 2023. The 2,483 large credit unions account for 98% of total credit union assets and remain a potential risk factor in a future major economic downturn.
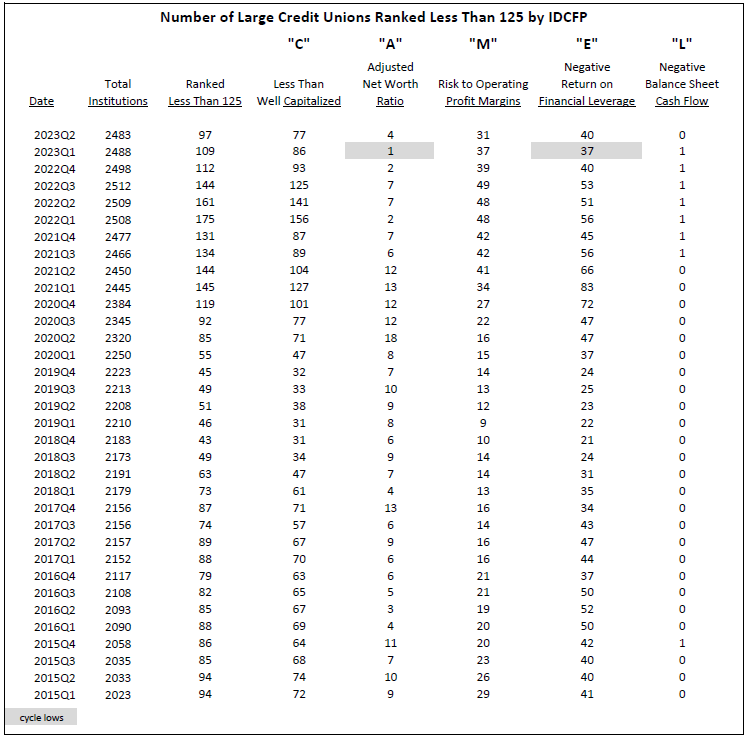
To determine this risk, we separate the credit unions ranked under 125, which is below investment-grade and the industry standard. As of the end of the second quarter 2023, 97 large credit unions were ranked below 125 by IDCFP, down from 109 the previous quarter, and a high of 175 in the first quarter of 2022.
The peak in institutions seen in early 2022 has been followed by a reduction of risk. The total number of below-grade institutions continues to decline, along with most categories of CAMEL. Only institutions with adjusted net worth ratio (the “A” in CAMEL) increased to 4 from 1 the previous quarter, and institutions with risk of return on financial leverage or ROFL (the “E” in CAMEL) increased to 40 in 2023Q2 from 37 in 2023Q1 (see Table I). To forecast risk in the credit union industry, every component of CAMEL as well as the total number of institutions must reach a low and subsequently climb in number.
Table I
The Risk Illustrated by IDCFP in 2005 to 2007 Forecast the 2008/2009 Credit Union Crisis
IDC successfully indicated a risk alert for the credit union industry as early as the fourth quarter of 2006, over a year prior to the financial and economic collapse of 2008 and 2009. Out of the 1,862 large credit unions in the third quarter of 2006, 108 were ranked below 125, or less than investment grade. The increase to 115 in the fourth quarter signaled the major risk alert for credit unions.
The “C” in CAMEL bottomed at 117 in the third quarter of 2006, but then recycled when it hit a low of 101 in the third quarter of 2007. The “A” low of zero was in the first quarter of 2005, the “M” low of 8 was in the fourth quarter of 2005, the “E” low of 31 was much earlier, in the first quarter of 2003, and the “L” component of CAMEL was zero in the second quarter of 2006.
In summary, IDCFP’s risk alert for the financial downturn of large credit unions, as well as, the entire credit union industry, was evident in the fourth quarter of 2006, successfully forecasting the financial problem to occur in 2008 and 2009 (see Table II).
Table II

Credit Unions Shift More Assets into Loans
Credit union total loans and leases were $1.575 trillion as of June 30, up $30.01 billion from March 31, according to S&P Global Market Intelligence data.1
Even through growth has slowed in 2023 relative to 2022 loans are becoming a more dominant feature of credit union balance sheets. As of June 30, the gross loans to assets ratio was 70.4%, an increase of 1.2 percentage points from last quarter and a substantial rise of 10.6 percentage points from the lowest point on March 31, 2021.1
In the second quarter, loan growth came from several different categories, from mortgages, to business loans, to unsecured loans and lines of credit. Conversely, fixed-rate first mortgages with a maturity of 15 years or less declined $2.57 billion. Among the largest credit unions in 2023Q2, categorized by total assets, only three of the top 20 reported a decrease in total loans and leases from the previous quarter.1
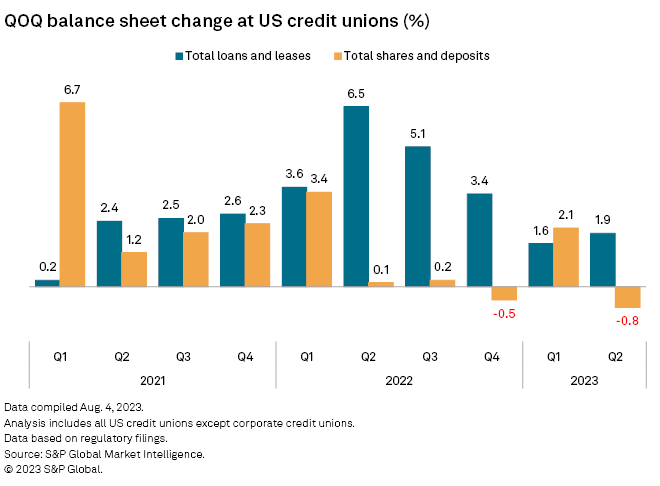
However, for the second time in the last three quarters, total shares and deposits diminished at US credit unions. The June 30 total was $1.895 trillion, down $14.45 billion from the previous quarter, representing the most severe decline in nearly 15 years (see Chart I).1
Chart I
1 - Credit unions add loans, shed deposits in Q2, S&P Global Market Intelligence, August 9, 2023
To view our products and services please visit our website. For more information about our CAMEL ratings, or for a copy of this article, please contact us at 800-525-5457 or info@idcfp.com.
John E Rickmeier, CFA
President
jer@idcfp.com
Robin Rickmeier
Marketing Director