Revision to Estimate of Growth in Brokered CDs
Brokered CDs Reaching Modest New Highs in 2024 and 2025
IDC Financial Publishing (IDCFP) has attempted over time to estimate brokered CDs for individual banks. The unknown in the equation has historically been the level of sweep accounts in brokered deposits. As of September 30, 2021, bank reports, sweep accounts for individual banks were available on the call reports.
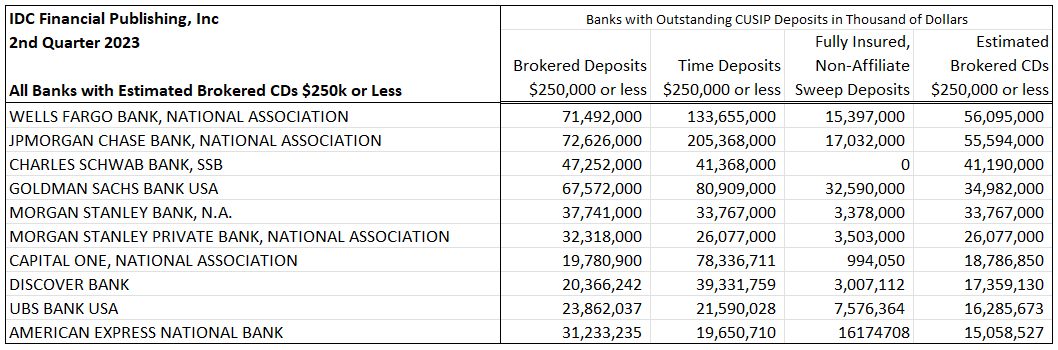
As of June 30, 2023, the IDCFP estimate of brokered CDs $250,000 or less as a sum of all banks was $633.5 billion compared to DTC value of $681.3 billion. The latter includes credit unions and a few foreign banks. IDCFP calculates the estimate, shown in Table I, by subtracting from the brokered deposits of $250,000 or less the fully insured sweep deposits, capped at the value of time deposits of $250,000 or less for banks with an outstanding CUSIP number for brokered CD issuance. IDCFP concludes the estimates for individual banks’ brokered CDs is reasonably accurate and available on request for your own marketing or other research needs.
The History
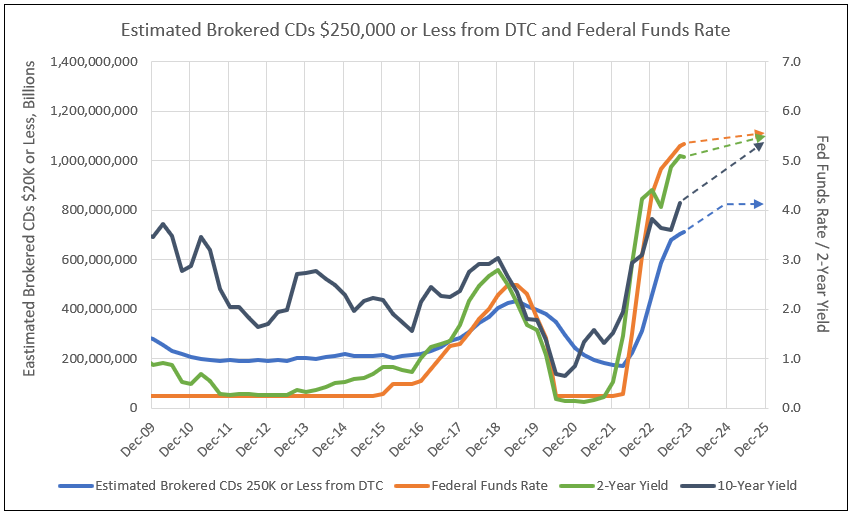
DTC Brokered CDs of $250,000 or less peaked in June 2019 at $433.3 billion and declined to $395.6 billion by December 31, 2019. The significant decline in 2020 was due to Covid and the actions of the Federal Reserve Bank to increase liquidity by adding Treasuries and mortgages to its balance sheet.
The average rate of decline in DTC reported brokered CDs was $15.2 billion a month in the last three quarters of 2020, and then fell to $8.4 billion a month in the first half of 2021, then the rate narrowed to $3.5 billion a month in 2021Q3, and then to $2.8 billion a month in the fourth quarter of 2021. From year-end 2021 to the end of February 2022 balances declined $3.2 billion a month.
However, since early 2022, due to increases in the Fed funds rate, DTC balances are rising, from $169.4 billion in February 2022, to $224.3 billion in June, to $458.9 billion in December 2022. This year, DTC balances reached $586.6 billion by March, and surged to $681.3 billion in June, and are $702.3 billion as of August 31, 2023.
Our Forecast Revision to Growth in Brokered CDs
Brokered CDs began increasing at an accelerated pace in February 2022 and continued through August 2023. However, since August, the monthly rate slowed to $6 billion and in the month of October CUSIPs outstanding declined for the first time in both 2022 and 2023. IDCFP projects brokered CDs of $250,000 or less to increase $12 billion in the remainder of 2023 to a year-end balance of $726 billion. An additional increase of $96 billion is expected by year-end 2024, raising the balance to $822 billion (see Chart I).
Chart I
Brokered CDs $250,000 or Less Estimated to Grow to $822 Billion by 2024 and Level Off in 2025
The Threat of Continued Quantitative Tightening and Other Reasons Behind the Rise in Long Bond Yields
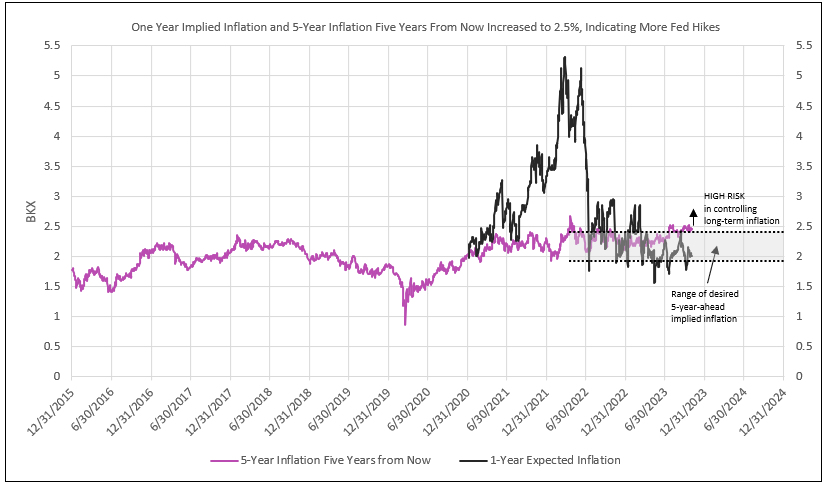
1. Five-year implied inflation 5 years from now is running at 2.5% or higher (see Chart II). Any recovery in 1-year implied inflation to over 2.5% is probably due to oil prices over $100, and would forecast further increases in the Fed Fund’s rate of 25 basis points in 2024.
Chart II
2. The increase in the Fed funds rate as a policy toll could be coming to an end with a 5.50% terminal rate.
3. Quantitative tightening (OT) takes over as the Fed continues to reduce its balance sheet.
4. OT along with new supply of Treasuries raises long term interest rates to 5% or higher on the 10-year T-Note.
- The federal government has passed a number of laws for the support of semiconductor reshoring, climate change, etc.
- These new laws are currently being funded, raising the amount of Treasuries raised by T-Bond auctions.
- Interest rates in Japan and Europe rose from negative levels a few years ago to new high positive levels. Foreign investors shun Treasuries due to U.S. dollar risk.
- China with its internal financial problems is limiting purchases of U.S. Treasuries.
- The combined effect of the above events raises U.S. long-term nominal and real interest rates.
5. The continued increases in the 10-year T-Note to 5% or higher raised the risk for banks with high-level unrealized losses or securities held to maturity, combined with percent of uninsured liabilities exceeding assets available for liquidation by a wide margin, especially if banks failed to hedge their U.S. Treasury risk.
6. For many banks, the dramatic increase and the associated cost in the level of brokered CDs raises the after-tax cost of funding (COF) near to or above the after-tax return on earning assets (ROEA), creating a narrow or negative leverage spread (LS). These banks experience a narrow or negative return on financial leverage and a limited return on equity capital. The lack of profitability limits growth and increases future risks.
The forecast for brokered CDs of $250,000 or less is for continued limited increases through 2025, making it a less viable alternative funding source.
Leading Banks Increasing Positions of Brokered CDs $250,000 or Less
IDCFP has estimates of brokered CDs $250,000 or less outstanding for each issuing bank, available on request. See below a sample list of banks.
Table I
To view all our products and services please visit our website www.idcfp.com. For more information on banks with brokered CDs outstanding, and the amount of these CDs, or for a copy of this article, please contact us at 800-525-5457 or info@idcfp.com.
John E Rickmeier, CFA
President
jer@idcfp.com
Robin Rickmeier
Marketing Director