Is Core Inflation Less Energy Under Control?
In the latest Consumer Price Index (CPI) data released by the Bureau of Labor Statistics, energy prices fell drastically, durable goods prices dropped, and food prices rose moderately, but the key area to watch remains in services. The CPI for Rent inflation, or the actual rents that tenants pay, accelerated for third month in a row.
Core CPI Rises
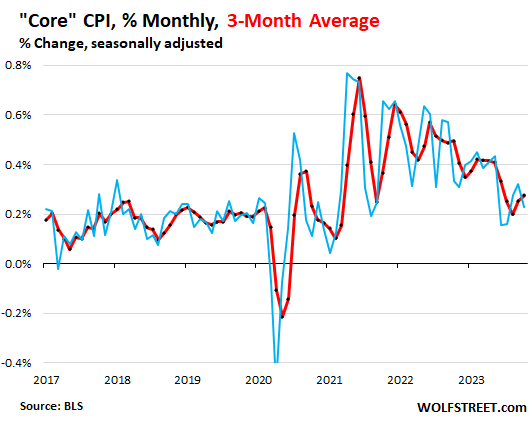
Core CPI, month-over-month rose by 0.23% in October, helped by the moderate month-to-month rise in core services. The three-month moving average rose by 0.28%, the biggest increase since June (see Chart I).1
Chart I
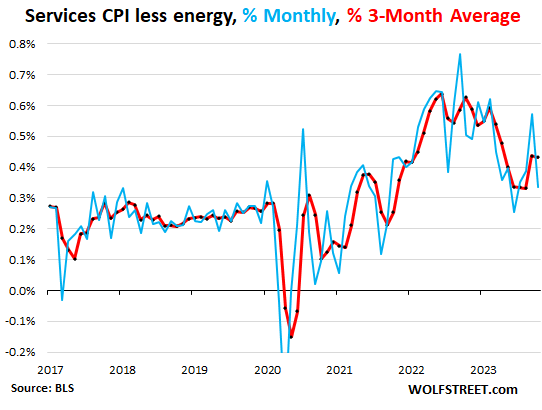
CPI for Core Services Less Energy Still Runs Hot
The CPI for core services less energy rose 0.34% in October on a month-to-month basis, or 4.2% annualized. The three-month moving average, rose by 0.43% in October, roughly the same increase as in September, or 5.3% annualized (see Chart II).1
Chart II
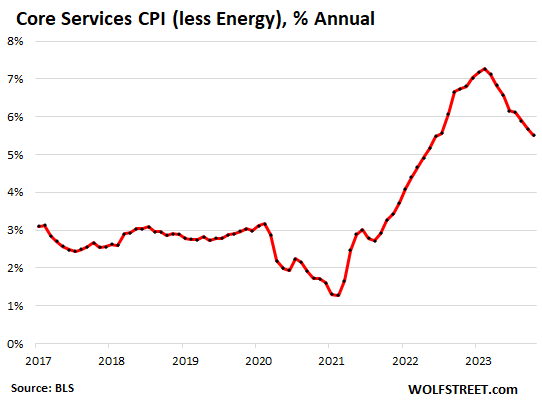
Year-over-year, the core services CPI is still an impressive 5.5%, despite the 34% collapse of the year-over-year health insurance CPI within it (see Chart III).1
Chart III
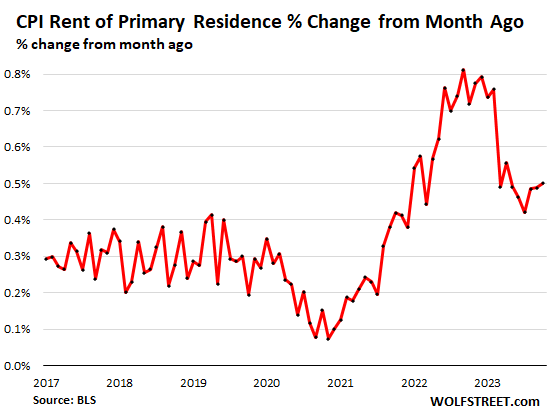
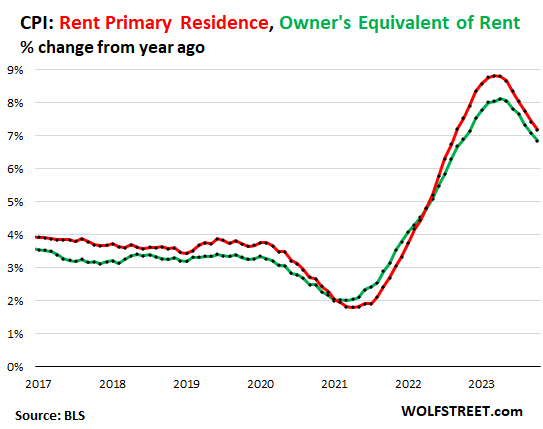
Rent of Primary Residence CPI Accelerates Further
The Rent of primary residence CPI further accelerated to +0.50% in October (+6.2% annualized), the biggest increase since April.
The Rent CPI is based on actual rents that tenants actually paid. The survey follows the same large group of rental houses and apartments over time and tracks what tenants actually pay in these units. The huge month-to-month spikes in rent in 2022 and early 2023 are gone, but after cooling a lot in the first half of 2023, increases of actual rents have begun to accelerate again.1
Chart IV
Year-over-year, the Rent CPI increased by 7.2%. Over the past three months, the month-to-month rent CPI has run at an annualized rate of over 6%, a rate which matches landlords’ reported earnings.1
The “Owners’ equivalent of rent” CPI rose by 0.41% in October from September (or 5.0% annualized), after 0.56% jump in the prior month, which had been the biggest increase since February. The OER index is based on what a large group of homeowners estimates their home would rent for. Year-over-year, the CPI for OER increased by 6.8% (see Chart V).1
Chart V
1 – Beneath the Skin of Inflation, Wolf Street, 11/14/2023
To view all our products and services please visit our website www.idcfp.com. For a copy of this article, please contact us at 800-525-5457 or info@idcfp.com.
John E Rickmeier, CFA
President
jer@idcfp.com
Robin Rickmeier
Marketing Director