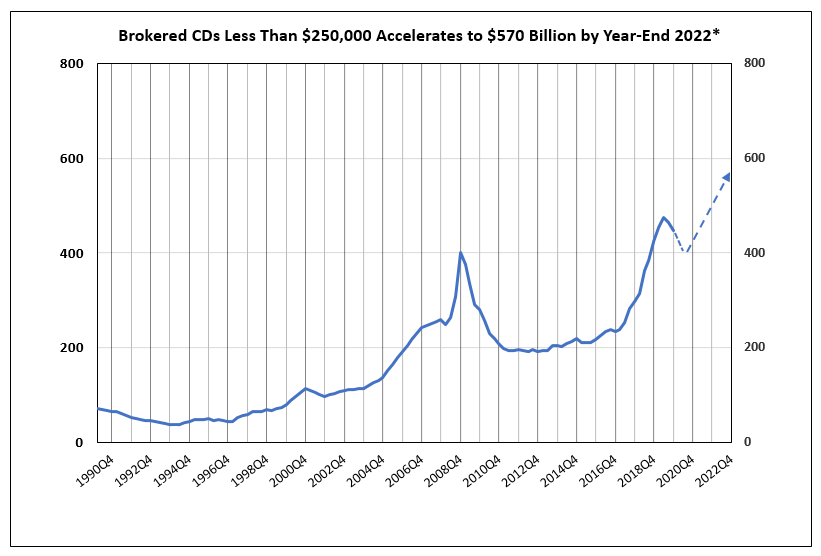
Insured Brokered CDs to Increase 28% to $570 Billion by Year-End 2022
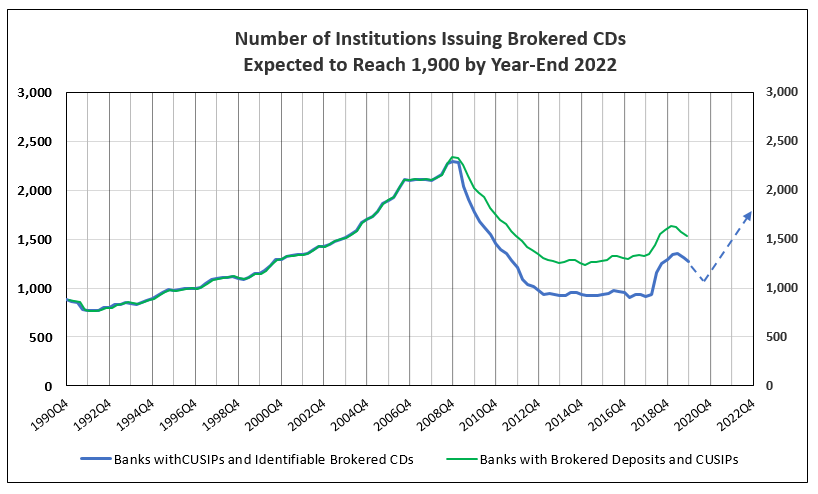
The Number of Financial Institutions Issuing Brokered CDs Continues to Grow
The number of institutions issuing brokered CDs has grown significantly since 2017. Banks, savings institutions and credit unions rose from a plateau of 930 in 2017 and increased to a peak of 1,356 in the 2nd quarter of 2019. However, the rise in the federal funds rate to 2.5% at year-end 2018 raised interest rates on brokered CDs above other deposit rates, as well as, above short-term T-Bill and T-Note yields in 2019. As a result, the growth in the number of institutions issuing brokered CDs less than $250,000 slowed to 1,276 by year-end 2019. At IDC Financial Publishing (IDCFP), we project the growth to reoccur later in 2020 with a return of a positive yield curve, and forecast the number of banks and credit unions to reach 1,900 by the end of 2022 (see Chart I & II).
Chart I
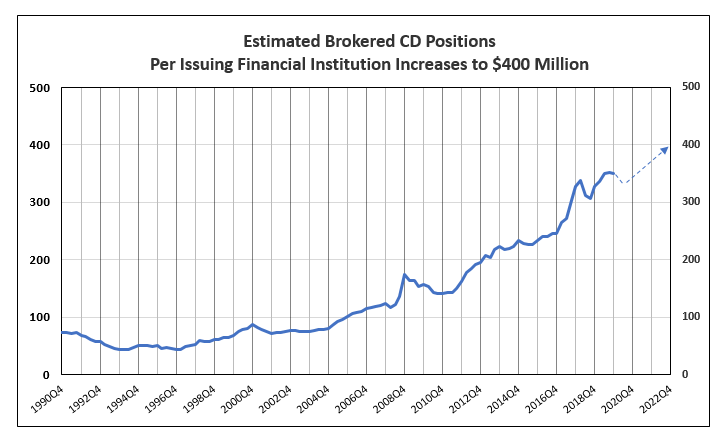
The Value of Brokered CDs per Issuing Institution Continues to Rise on Trend
The value of brokered CDs issued per financial institution grew exponentially over the last two decades, due to an increase in government insured levels to $250K, bank mergers, and strong growth in loans for those core banks and credit unions issuing brokered CDs. The value grew from an average of $65 million in 1999 to $350 million by the 4th quarter of 2019.
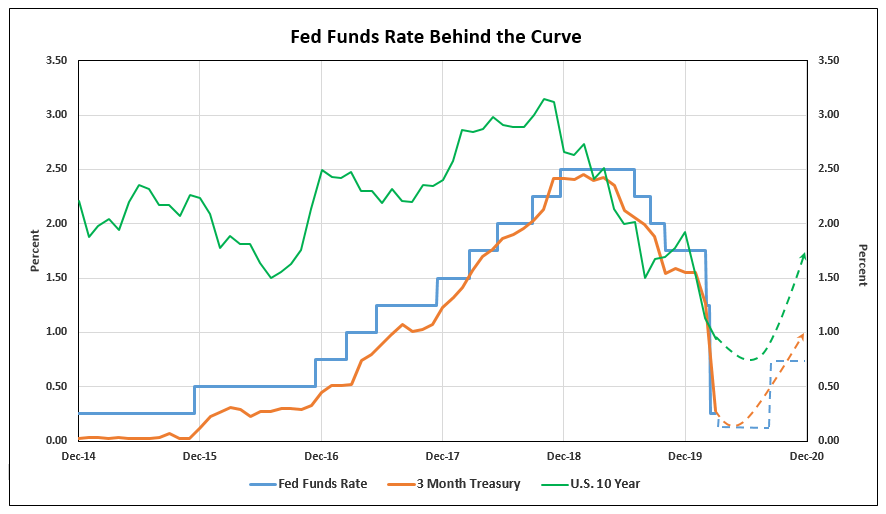
The inverted yield curve, that resulted from the 3-month T-Bill yield above the 10-year T-Note yield in 2019, and again in 2020, made brokered CDs an expensive source of funding (see Chart II). The reduction in the federal funds rate to the range of 1.50% to 1.00% this month, and then to a range of 0.25% to 0% as of March 15th, reduced the 90-day T-Bill current yield to 0.23%, below the 0.80% yield on the 10-year T-Note. A recovery in loan demand later in 2020 and the continued increase in the 10-year T-Note yield toward 1.75% creates demand for brokered CDs.
Chart II
Each quarter, IDCFP divides our estimate of the total brokered CDs less than $250K by the total number of financial institutions issuing these CDs. This determines the estimated average value of insured brokered CDs per issuing financial institution. In the 4th quarter of 2008, the average value peaked at $175 million, and then fell to $143 million in 2011, as a result of the banking crisis. Since then, the value per institution has risen, reaching $350 million in the 4th quarter of 2019. We forecast this dollar growth will be $4.2 million per quarter, reaching a record average of $400 million per institution by year-end 2022 (see Chart III).
Chart III
Growth in Outstanding Brokered CDs Forecast at $17 Billion a Quarter
As tax cuts, deregulation, infrastructure spending, and other government initiatives drive increased spending, GDP growth is expected to expand 2.5% a year in 2021 and 2022. This, in turn, will create bank lending and increase the number of financial institutions issuing brokered CDs. Currently, outstanding brokered CDs account for 40.6% of time deposits, up from 21.3% in the 4th quarter of 2008. This percentage of outstanding brokered CDs to time deposits has grown on trend from 2008 to 2019 but is expected to remain near current levels through year-end 2022.
IDCFP forecasts the growth of brokered CDs outstanding through year-end 2022. We multiply the number of commercial banks, savings institutions and credit unions with outstanding brokered CDs, which is expected to reach 1,900, times our estimate of the average of insured brokered CDs per issuing financial institution ($400 million). Therefore, we forecast brokered CDs outstanding to increase 28% from the estimated $447 billion at 4th quarter-end 2019, to reach $570 billion by year-end 2022 (see Chart IV).
Chart IV
For further information or to view our products and services please visit our website www.idcfp.com or contact us at 800-525-5457 or info@idcfp.com.
John E Rickmeier, CFA, President, jer@idcfp.com
Robin Rickmeier, Marketing Director