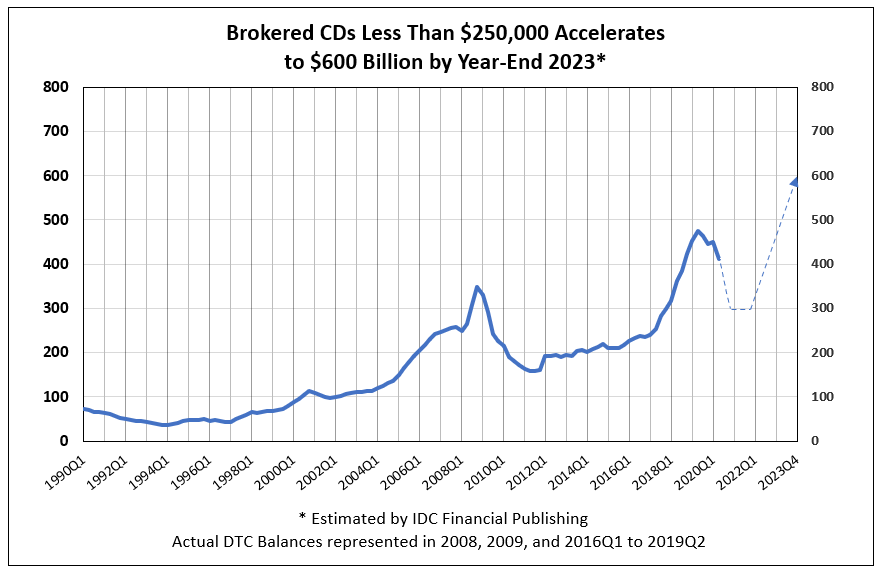
Insured Brokered CDs to Increase 46% to $600 Billion by Year-End 2023
The Number of Financial Institutions Issuing Brokered CDs Temporarily Declines
The number of institutions issuing brokered CDs grew significantly in 2018 and 2019. Banks, savings institutions, and credit unions rose from a plateau of 961 in 2017 and increased to a peak of 1,356 in the 2nd quarter of 2019.
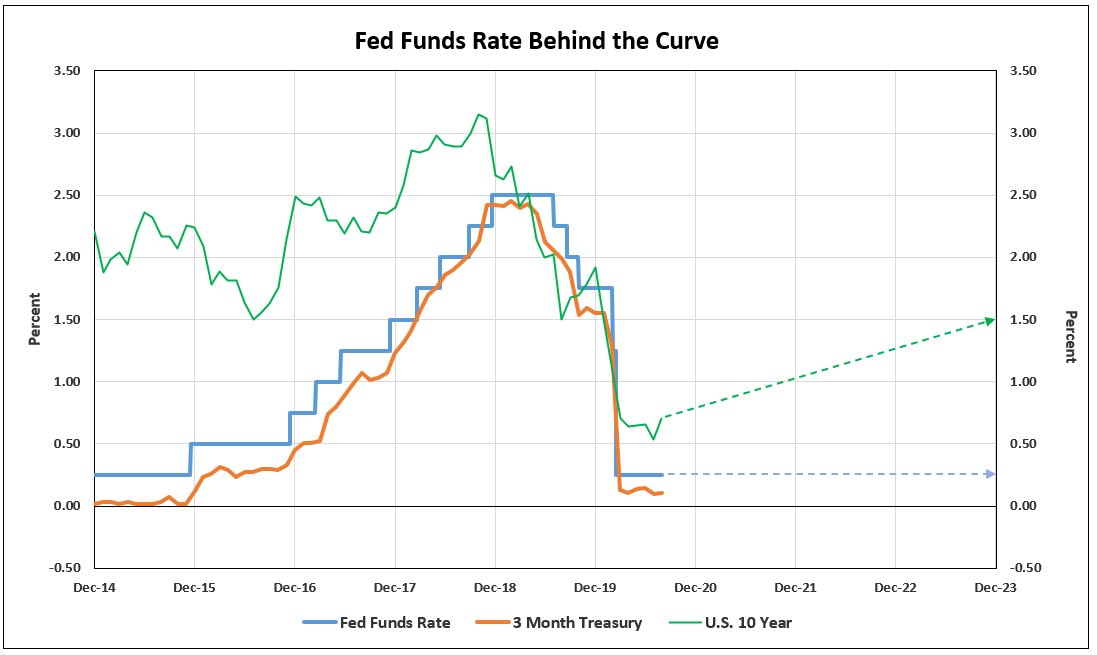
The subsequent decline was due to, first, the rise in the federal funds rate to 2.5% at year-end 2018, raising interest rates on brokered CDs above other deposit rates, and above short-term T-Bill and T-Note yields in 2019. As a result, the growth in the number of institutions issuing brokered CDs less than $250,000 slowed to 1,278 by year-end 2019. Second, the advent of Covid-19 in the first quarter of 2020 reduced short-term US Treasuries to zero, as the Federal Reserve stimulated the economy. As a result, financial institutions issuing brokered CDs fell to 1,197 by the end of the second quarter.
At IDC Financial Publishing (IDCFP), we project continued growth in the total value of brokered CDs less than $250,000. The number of institutions issuing these CDs will decline to 1000 by the end of 2020. Then, following economic recovery from Covid-19 and a more positive yield curve, we forecast the number of institutions issuing these CDs to rise again, reaching 1,450 by the end of 2023 (see Chart I & II).
Chart I
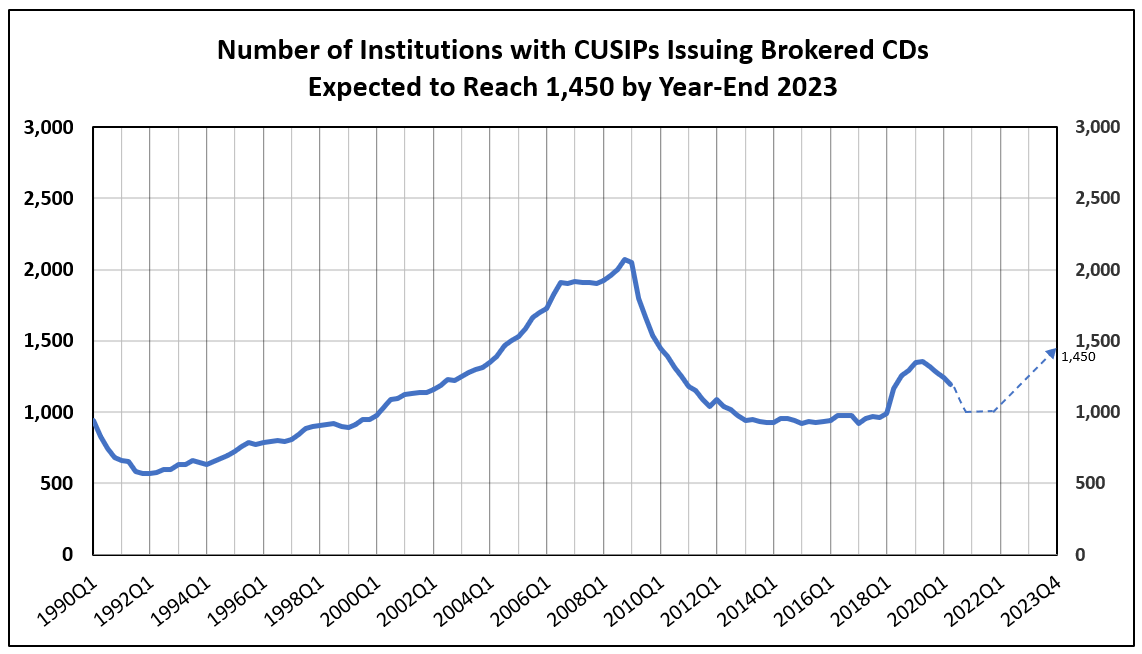
Chart II
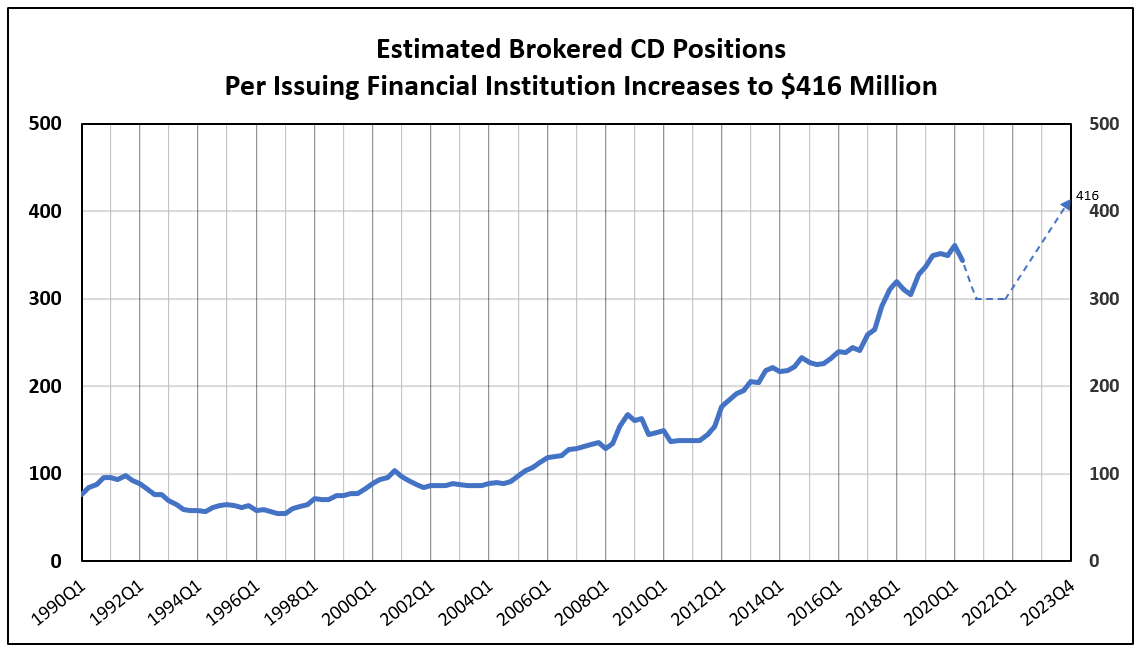
The Value of Brokered CDs per Issuing Institution Continues to Rise on Trend
The value of brokered CDs issued per financial institution grew exponentially over the last two decades, due to an increase in government insured levels to $250K, bank mergers, and strong growth in loans for those core banks and credit unions issuing brokered CDs. The value grew from an average of $78 million in 1999 to a peak of $360.6 million by the 1st quarter of 2020.
Each quarter, IDCFP estimates the total value of brokered CDs less than $250K and divides it by the total number of financial institutions issuing these CDs. This determines the estimated average value of insured brokered CDs per issuing financial institution. In the 4th quarter of 2008, the average value peaked at $166 million, and then fell to $137 million in 2010, due to the banking crisis. Since then, the value per institution has risen, reaching a peak of $361 million in the 1st quarter of 2020. With the advent of Covid-19 and near-zero short-term treasury yields, brokered CDs per issuing bank fell to $343.7 million as of June 30th and estimated to fall again to $300 million by year-end. Due to economic recovery in 2022 and 2023, we forecast this future dollar growth will be $9.7 million per quarter, reaching a record average of $416 million by year-end 2023 (see Chart III).
Chart III
Growth in Outstanding Brokered CDs Forecast at $17 Billion a Quarter
Following economic recovery from Covid-19, stimulus from Federal spending, i.e., tax cuts, deregulation, infrastructure spending, and other government initiatives, will drive increased spending. GDP growth is expected to expand to above 2.5% a year in 2021 through 2023. This, in turn, will create bank lending, as the U.S. 10-year rises above 1%, and increase the number of financial institutions issuing brokered CDs. Currently, outstanding brokered CDs account for 30% of their time deposits, up from 19% in the 4th quarter of 2008. This percentage has grown on trend from 2008 to 2019 and is expected to level off at 30% through year-end 2023.
To forecast growth of DTC brokered CDs outstanding, we multiply the number of commercial banks, savings institutions, and credit unions with outstanding brokered CDs, times our estimate of the average of insured brokered CDs per issuing financial institution. Though we expect total brokered CDs will continue to decline to $300 billion and remain there through 2021Q4, we anticipate a reversal and that number to double by year-end 2023. Following economic recovery, we forecast DTC brokered CDs outstanding to increase 46% from the reported $411 billion at 2nd quarter-end 2020 and reach $600 billion by year-end 2023 (see Chart IV).
Chart IV
For further information or to view our products and services please visit our website www.idcfp.com or contact us at 800-525-5457 or info@idcfp.com.
John E Rickmeier, CFA, President, jer@idcfp.com
Robin Rickmeier, Marketing Director