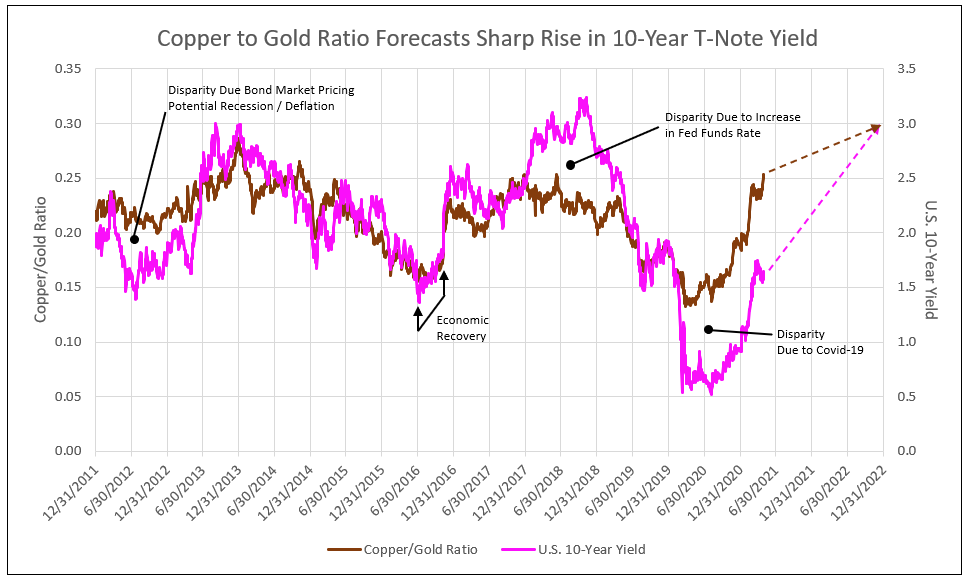
Copper to Gold Ratio Forecast a 2.4% Yield on the U.S. 10-Year T-Note by the Fall of 2021 and 3% in 2022
The U.S. 10-year is expected to rise significantly, led by the breakout of the German 10-year yield from its inverse head-and-shoulder pattern from 2019 to date. The German 10-year broke out to -0.17% recently, and is forecast to rise to zero, and then +0.40% in 2021, leading to U.S. 10-year increases.
History of the Copper-to-Gold Ratio
The recent rally to all-time highs in copper raised the U.S. price to a peak of $4.52. The price surge reflects stimulus measures, vaccine rollouts and pledges for climate change reform, which combined, are fueling global recovery from the pandemic. Copper underpins the rally in metal markets from aluminum to iron ore.
With copper demand set to soar once more, there are mounting concerns that producers will struggle to fill the gap as they attempt to overcome a host of technical and regulatory pressures. Port workers in Chile, the top producers of copper, are protesting the government’s pandemic relief policies. Producers worry that plans to raise mining royalties could stifle investment and make the country less competitive. Demand compared to supply point to rising copper prices, reaching as high as $6.00 in 2022.
The copper-to-gold ratio is highly correlated to the U.S. 10-year yield since 2015. A disparity occurred in 2012 and 2013 as the bond market priced potential recession / deflation. The subsequent change in sentiment to recovery / inflation returned the 10-year yield to correlation to the copper to gold ratio.
A second disparity occurred in 2018 and the first half of 2019 due to the Federal Reserve increasing the Federal Funds rate, lifting the 10-year yield above the 2.5% level forecast by the copper to gold ratio. Correlation resumed in the second half of 2019.
Disparity reappeared from February to July 2020, due to Covid-19, the lockdowns and resulting economic recession. Since July 2020, the spread between the copper-to-gold ratio and the 10-year yield narrowed, as the copper-to-gold ratio rose from a low of 0.14 to above 0.20, forecasting a recent steady rise in the 10-year yield from 0.5% to 1.7%. The current ratio of 0.24 forecasts the potential for the 10-year T-Note yield to rise to 2.4% by the fall of 2021.
The significant and sharp recovery in the 10-year yield is also due to the expectation of successful vaccinations and potential herd immunity to Covid-19. This expectation indicates a marked recovery in the U.S. economy with a commensurate rise in inflationary expectations. A high-end increase in 2022 in the copper price to $6 and gold to $1800, provides a 0.30 ratio of copper-to-gold, or a forecast of a 3% yield on the 10-year T-Note (see Chart I).
Chart I
Many analysts use this ratio to forecast yields, but what other evidence supports this projection? See the following five observations.
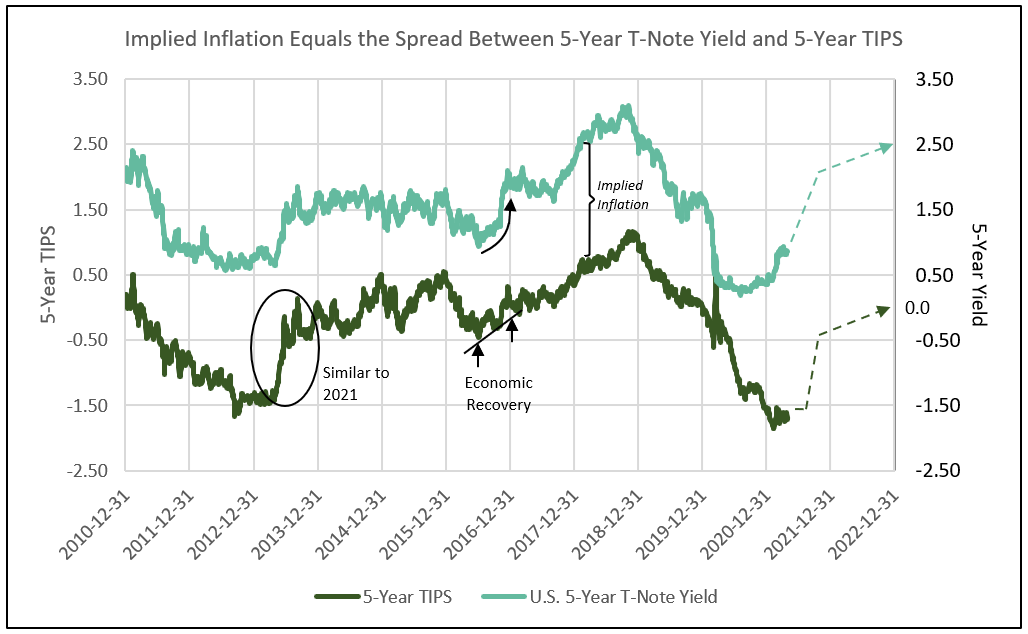
1. The inflation-protected 5-year TIPs yield in 2021 is expected to mirror its sharp recovery to zero in 2013.
The 5-year real or TIPs yield became most negative in 2013, and again in 2021 when it reached -1.5% due to fear of recession and deflation. An end to such fears allows a rebound toward zero in the 5-year TIPs yield as occurred in mid-2013. With the real yield currently suppressed at -1.6%, a rise in nominal yield creates a widening spread between real and nominal, or higher implied inflation. Implied inflation in 2021 could rise to 3%, before the TIPs yield finally rebounds to -0.5% by the fall of 2021 and then increasing to zero in 2022 (see Chart II).
Chart II
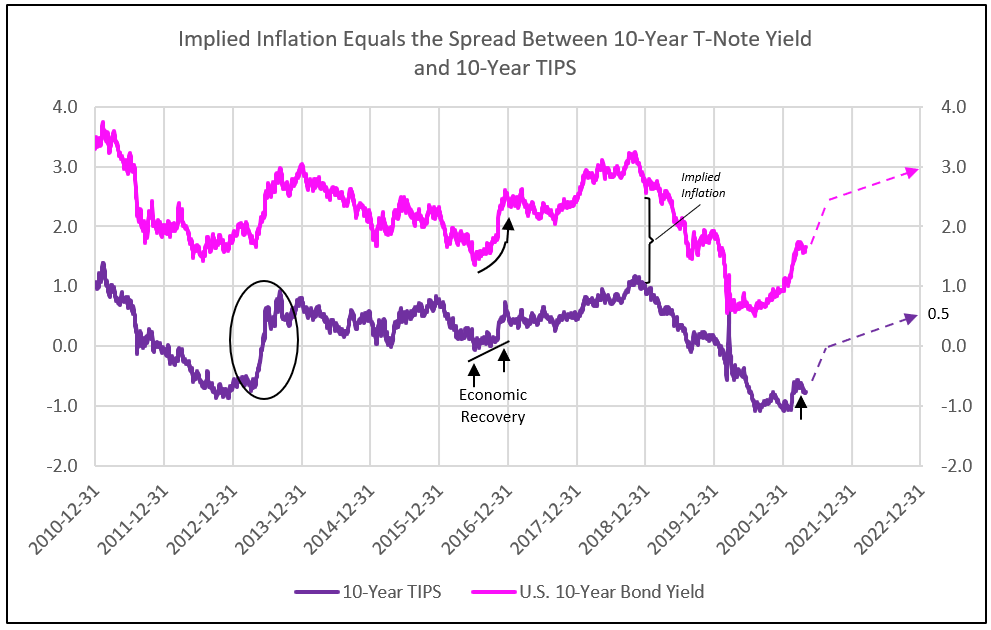
2. The 10-year TIPs yield climbs to zero in 2021, raising the nominal yield to 2.4%, and implying 2.4% 10-year inflation, followed by the TIPs yield reaching 0.5%, raising the normal yield to 3% in 2022.
Similar to 2013, a change in outlook from recession / deflation to recovery / inflation lifts the 10-year real yield (TIPs) to zero from the lows of -1.0%. Recent implied inflation rose to 2.4%. The higher 10-year TIPs yield of zero by the end of 2021 raises the nominal yield to 2.4%. Further gains in the TIPs to 0.5% in 2022 and 2.5% implied inflation forecasts a 3.0% nominal 10-year yield by year-end 2022 (see Chart III).
3. Economic recovery also lifts yields higher, as was the case in 2016.
The impact of economic recovery, with a 100-basis point rise in the TIPs yield, raised 5- and 10-year nominal yields in 2016 (see Chart II and III). The combination of the sentiment shift of 2013 in the TIPs yield, and economic recovery in 2016, together, forecast significant yield increases for 2021 and 2022 in the U.S. 10-year.
Chart III
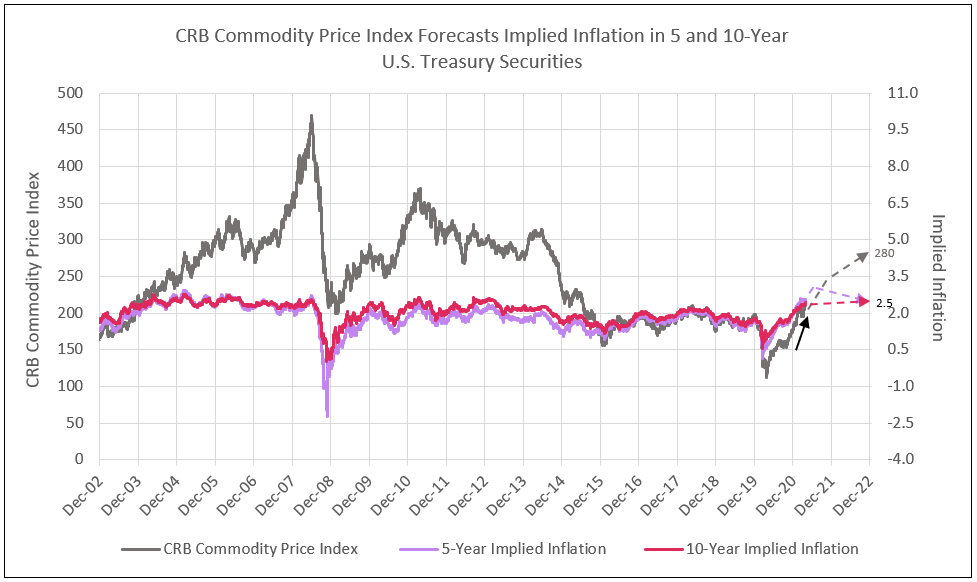
4. The rise today in 5-year implied inflation above the 10-year levels is consistent with the economic recovery and commodity boom of 2004.
A commodity super-cycle in 2003 to 2006 initially created an inversion in the 5-year implied inflation above 10-year levels in 2004. Both 5- and 10-year implied inflation rose above 2.5%, temporarily.
A similar pattern is developing in 2021 with the 5-year implied inflation rising above 2.5%. The primary reason for the inversion is the Fed’s determination to keep short-term treasury yields slightly above zero, restricting the 5-year TIPs yield as the nominal yield increases, leading to higher short-term implied inflationary expectations (see Charts II and IV).
Another reason for the inversion is the market expectation for higher inflation to be temporary, priced in 5-year TIPs, but not in 10-year TIPs (see Charts II and III).
Chart IV
5. Leading analysts and veteran strategists are weighing in and supporting this outlook for a recovery to last through at least 2021.
Ed Yardeni, veteran strategist, is comfortable with yields above 2%, given the expected economic and earnings recovery.
“[Rising yields] is an indication that the economy is doing well and that will be very good for earnings,” said Yardeni, the president and founder of Yardeni Research Inc. “The years prior to the pandemic, bond yields were 3% to 4%. So I don’t really have a problem with 2% to 3%, which is probably where they’re likely to settle in the second half of the year.”1
Underpinning Yardeni’s confidence is an economy roaring back from the Covid-19 pandemic, buttressed by vaccines and President Joe Biden’s $1.9 trillion stimulus package. It’s those things that have pulled yields up from below 1% and set the stage for S&P 500 companies to rattle off the streak of earnings growth analysts currently estimate -- at least six quarters of double-digit expansions, including a 49% surge in the June-April period.1
JP Morgan CEO, Jamie Dimon, stated in his annual letter to shareholders earlier this month that an economic “Goldilocks moment” is likely around the corner, “fueled by pent-up consumer savings, aggressive stimulus spending, easy Federal Reserve policy and a strong vaccine rollout.”2
In this article published April 12th, IDCFP discussed the stock market outlook, quoting James Siegel, finance professor from the Wharton School, “the economic and stock market recovery with growth in tangible assets, earnings and equity,” (offered by banks and epicenter stocks), “…are only in the third inning.”
Siegel “expects the stock market’s rally will persist at least throughout this year. However, …investors will have to be cautious once the Federal Reserve adjusts its highly accommodative monetary policies.”3
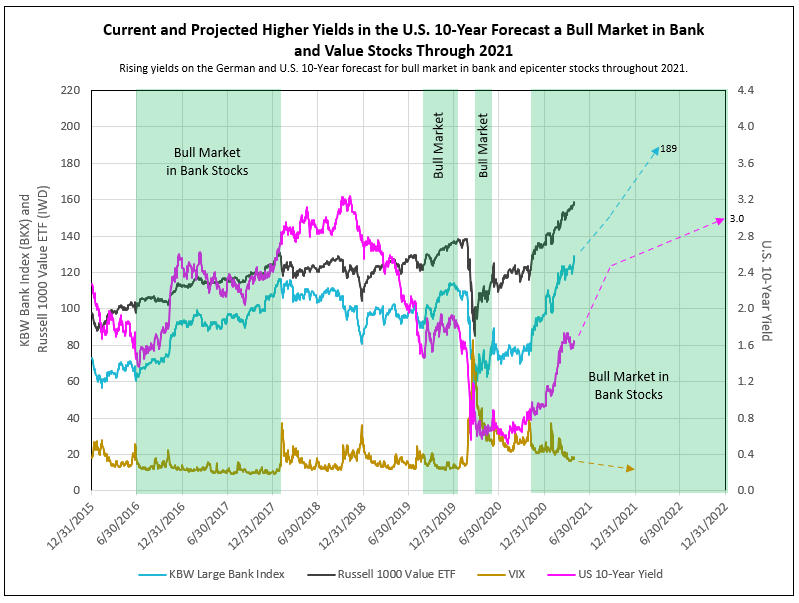
The Major Beneficiaries of a Rising 10-Year Yield and Low Short-Term Treasury Yields are the Banks, Offering a 54% Appreciation Potential Over the Next Year
Economic recovery, following the battle against Covid and resulting recession, provide two key ingredients that benefit banks:
- A strong economic recovery in GDP of 6% to 8% in 2021 provides 6% to 8% loan growth in the second half of 2021.
- A rise in the 10-year to 2.4% by fall of 2021, with a low 2-year T-Note yield, widens the spread between bank’s loan yields and deposit costs.
In addition to bank stocks, the major beneficiaries of the economic recovery, with the Federal Reserve stimulus controlling short-term rates and the fiscal policy stimulus from Federal Government spending, outperform the average of epicenter and value stocks (see Chart V).
Chart V
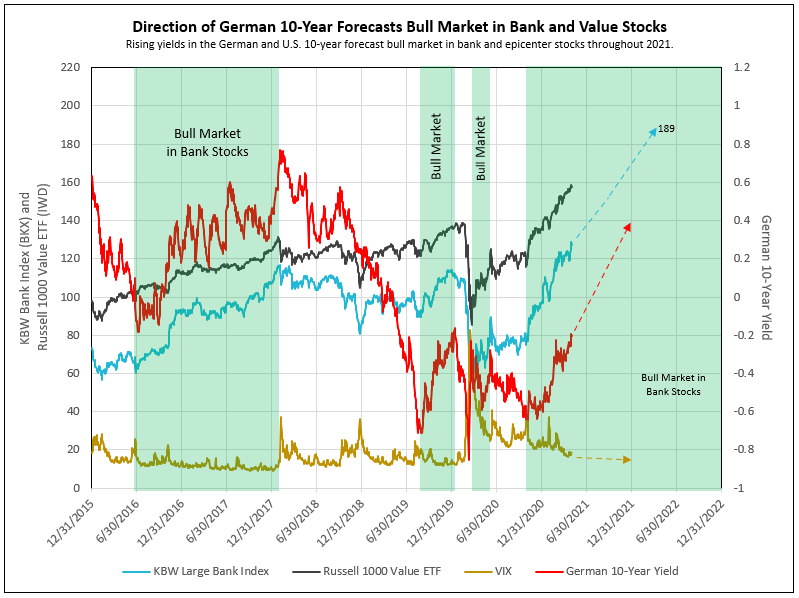
Breakout of German 10-Year Confirms Copper to Gold Ratio Forecast
The daily high in the German 10-year yield of -0.20% on April 28th indicates this yield about to break out of the neckline of the head and shoulders pattern formed from 2019 to date. The breakout forecasts a +0.4% German 10-year yield, and, with a 200-point spread, a 2.4% US 10-year T-Note yield; confirmation of the 2021 forecast from the copper-to-gold ratio (see Chart VI).
Chart VI
1 - bloomberg.com, Ed Yardeni Can Live With Higher Yields for the Sake of Earnings
2 - forbes.com, JPMorgan’s Jamie Dimon Predicts An Economic Boom That Could ‘Easily’ Last Until 2023
3 - cnbc.com, ‘Enjoy this ride’ — Wharton’s Jeremy Siegel says stock market could go up 30% before boom ends
To view all our products and services please visit our website www.idcfp.com.
For more information about our ranks, or for a copy of this article, please contact us at 800-525-5457 or info@idcfp.com.
John E Rickmeier, CFA, President, jer@idcfp.com
Robin Rickmeier, Marketing Director