The Decline in the Price of Gold (Inverted) in 2013, 2016 and 2020 Predicted the Sharp Rise in the 10-Year TIPS Yield
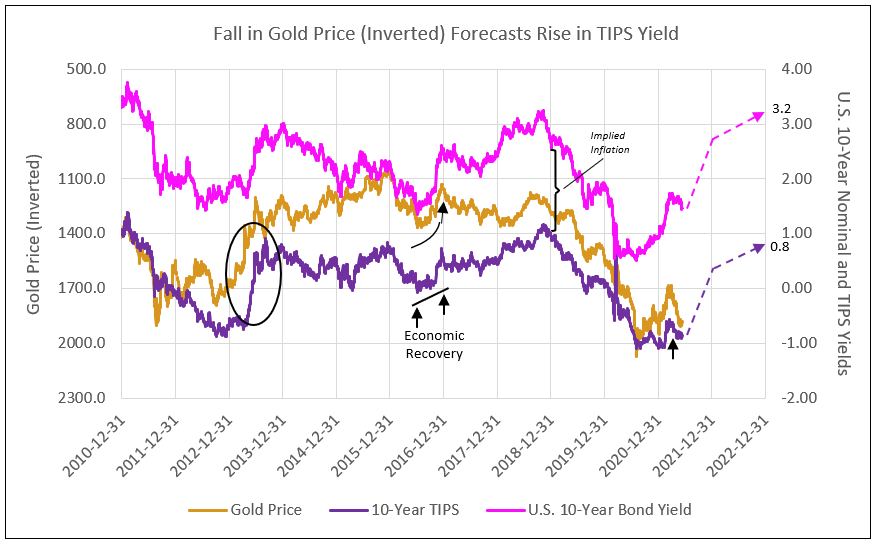
Historically, the fall in gold prices (left scale inverted in the chart below) forecast the sharp recovery in the 10-year TIPS yield, both in 2013 from -0.8% to 1.0%, and in 2016 from zero to 1.0% (see Chart I).
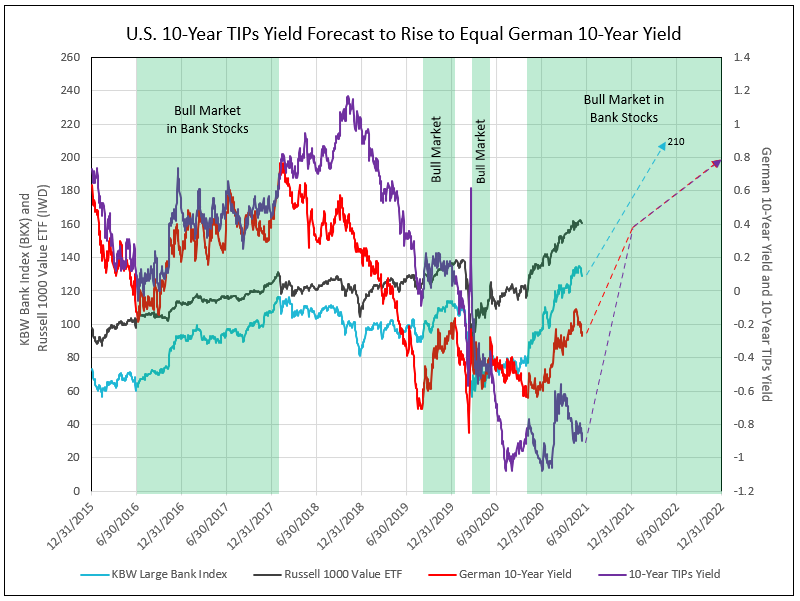
In a previous article from June 1st, IDC Financial Publishing (IDCFP) discussed the correlation between U.S. 10-year TIPS and German 10-year yields. The recent rise in the German 10-year yield above -0.21% (neckline of reverse head-and-shoulder pattern) to 0.07% in May 2021 forecasts a rise in German yields to 0.40% in 2021. As a result, U.S. 10-year TIPS yield is expected to recover to zero in 2021 and, potentially, reaching 0.4% by year-end (see Chart II).
The timing for such a sharp rise in the TIPS yield requires a significant decline in the price of gold. Dr. Ed Yardeni pointed out in June 2013, “the price of gold is highly correlated with the inverse of the TIPS yield…this year’s free-fall in the price of gold is astonishing. It is also astonishing how well it predicted the jump in the TIPS yield.”1
Gold prices, historically, declined in periods of 2% plus implied inflation (nominal less TIPS yields), forecasting a sharp rise in the TIPS yield. This occurred in 2013, 2016 and from August 2020 to February 2021, as illustrated by inverted gold prices in Chart I. Conversely, the peaks in the TIPS yield were forecasted by previous lows in gold prices (peaks on Chart I) in 2015 and 2018.
If gold and TIPS price expected inflation, why does gold decline and forecast a rise in TIPS yields? TIPS pay the rate of inflation over 10 years. Once the TIPS yield prices implied inflation required by the market (today’s rate is 2.5%), the TIPS yield reflects both expected real growth in the economy over 10 years and Federal Reserve policy. Today, that policy includes massive easing and purchases of U.S. Notes and Bonds, as the Fed expands its balance sheet. As the policy of easing changes to less purchasing, gold prices, historically, have anticipated these changes in Fed policy. It is important to note, TIPS yields were negative only in 2013 and today, both periods of large balance sheet expansion following a major recession.
The rise in gold prices from March 8, 2021, correlates to the selloff in the TIPS yield from -0.56% to -0.90%. The recent peak and reversal in the price of gold (as indicated by a sell from one of the most recognized technical analysts) forecasts the decline in gold prices and a rise in the TIPS toward zero.
A TIPS yield of zero or higher with 2.4% implied inflation forecast a nominal 10-year T-Note yield as high as 2.4% in 2021 (see Chart I). An increase in both the nominal U.S. and German 10-year yields forecast a 50% appreciation in the KBW large bank index in 2021 and into 2022 (see Chart II).
Chart I

Chart II

A Closer Look at the Gold Price Forecast of the 10-Year TIPS Yield
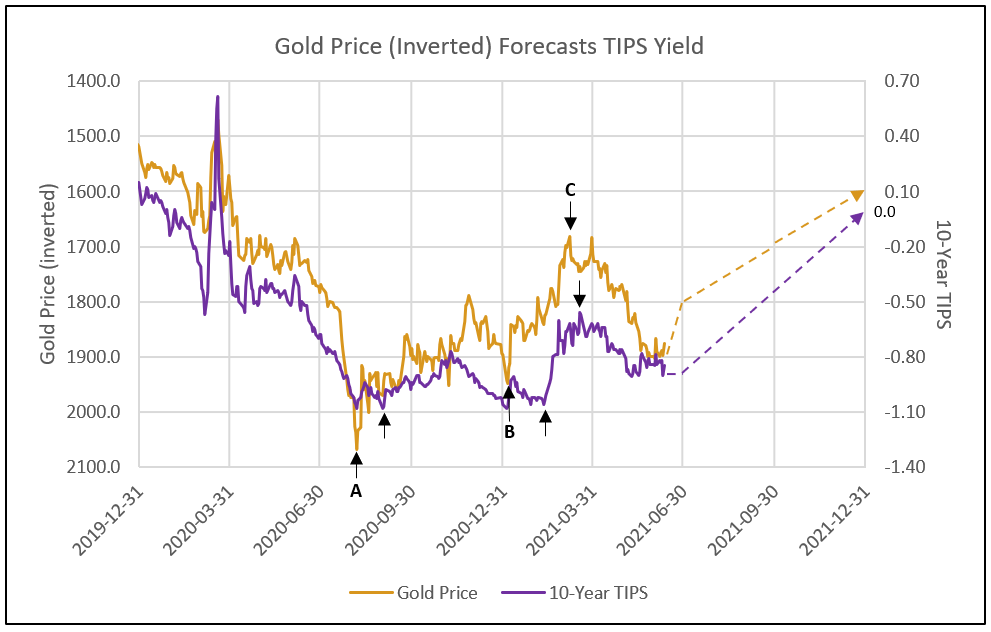
As seen in Chart III, the high price in gold, shown inverted as a low, occurred in August 2020 (A) and preceded the low in TIPS yield by 30 days. The second high gold price, also plotted inverted (B), preceded the TIPS low by 30 days. The low in gold price, plotted inverted as a peak (C), on March 8, and increase through June 2, led the decline in the TIPS yield by a few weeks.
Chart III

The decline in the TIPS yield to -0.9% in May/June was forecast by sharp rise in gold prices (plotted as a significant decline on Chart III), which in turn reduces the nominal 10-year yield to 1.5% and below (see Chart I). On June 10th, the 10-Year hit an intraday low of 1.43%, poising benchmark 10-year notes for their biggest weekly gain in a year.2
In the short term through June, the yields on the 10-year both TIPS and nominal are abnormally impacted by a large short position in Treasuries. With pensions nearly fully funded, the first time since 2008, pension managers are switching to fixed income from equities to lock in this new fully funded position. These actions are creating the current, unusually low yield levels in the 10-year, according to Allianz SE chief economic advisor Mohamed El-Erian.2
The 20-year Treasury Bond ETF 14-day relative strength index rose to 69 the week ending June 11, 2021. This is the highest reading since August 4, 2020, when the RSI reached 69.2
The overbought condition in U.S. Treasury bonds reflects covering of the massive, short position in these bonds as the pension managers re-balance to protect their fully funded positions. The overbought condition in long Treasuries also correlates to the overbought condition in gold at 1908 on June 2, 2021.
The key is a continued decline in gold prices for the remainder of June, forecasting the recovery in 10-year yields in July 2021 to higher levels. A decline in gold to 1600 by year-end 2021 forecasts a zero 10-year TIPS yield, up from -0.9% today. In 2012-2013, gold fell from 1800 to 1400 as TIPS yields rose from -0.9% to zero.
1 - Dr Ed’s Blog, Gold & TIPS (excerpt)
2 - Bloomberg.com, Five Things You Need to Know to Start Your Day, June 11.
To view all our products and services please visit our website www.idcfp.com. For more information about our ranks, or for a copy of this article, please contact us at 800-525-5457 or info@idcfp.com.
John E Rickmeier, CFA, President, jer@idcfp.com
Robin Rickmeier, Marketing Director
