The Impact of German 3-Month and 10-Year Yields on the Stock Market, Especially Bank Stocks
In IDC’s previous article “How the German 10-Year Yields Forecast the Beginning and End of Bull Markets in Bank and Value Stocks,” the research pointed out the 10-year TIPS yield combined with the German 10-year forecast two major bull markets in bank stocks, from December 10, 2012 to February 15, 2018, and from October 29, 2020 to date, and into 2022.
The following article illustrates how spike lows in the German 3-month yield and the steepening of the German short-term yield curve forecasts cycle lows in the German DAX and S&P, as well as how short-term German yields assist in forecasting cycle lows in bank stocks. In addition, we detail how the fundamentals of banks’ operating and financial returns, combined to equal ROE, demonstrate the superior performance of bank stocks in the two major bank stock bull markets in the last decade (from December 2012 to February 2018 and from October 2020 to today and into 2022).
Steepening of the German Short-Term Yield Curve Forecasts Cycle Lows in DAX, S&P 500 and Bank Stocks (BKX)
In Germany, the 3-month yield periodically spikes to a low, steepening the German yield curve relative to a lesser decline in the German 2-year yield. Historically, the German 3-month yield declined to negative values beginning year-end 2015. Subsequently, a spike low in the German 3-month yield below -0.70% or more has called short-term cycle lows in the DAX (see Chart I), the S&P 500 (see Chart II), and the KBW Large Bank Index (see Chart III).
The Bundesbank of Germany relies on a steepening yield curve to stimulate its economy. The Federal Reserve, on the other hand, limits the low in the Fed funds rate to zero. When the German 3-month yield spikes a low below -0.70% this signals a steepening yield curve in Germany, and further translates to a cycle low in the German DAX, the U.S. S&P 500 and BKX bank indices.
The ability for a spike low in the German 3-month to forecast the S&P 500 and bank stocks relates to interest rate arbitrage between Europe and the U.S. and the inter-relationships between the two economies. The correlation to market lows illustrates the point.
Table I
Dates and Yields at Cycle Low in Short-Term German Yields
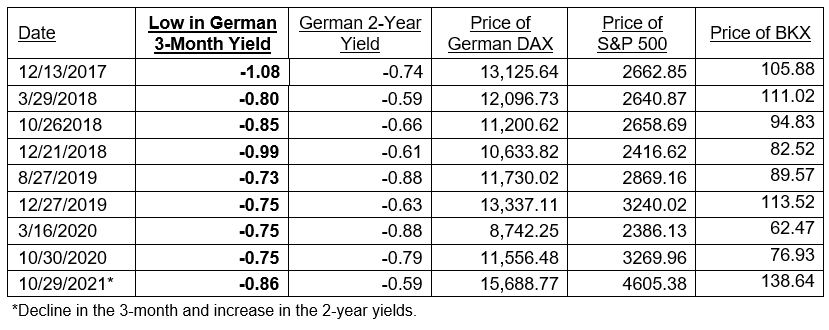
The most recent cycle low in the DAX, S&P 500 and BKX determined by the German 3-month and 2-year yields is different than in the past. Historically both German yields declined, with the cycle low in the 3-month signaling the low in the equity markets. On October 27, 2021, however, the 3-month fell significantly to -0.85%, while the 2-year rose to -0.64% from -0.67% a few days earlier. This fall in the German 3-month and rise in the 2-year created a spike low in the corresponding short-term yield spread and forecast the cycle low in equities (see Charts I, II and III).
The Federal Reserve has a different problem, as it won’t allow negative short-term rates. Only the TIPS yields are negative. The U.S. yield curve rises from a zero Fed funds yield to the 30-year bond yield. The nominal yield curve is normally a positively sloping line with the short end currently held down by a zero Fed funds rate. Today, however, higher reported inflation is priced in implied inflation, which lifts yields along the curve, forcing TIPS yields to record negative levels, and causing distortions in yield spreads between various maturities.
As an example, current reported inflation recently increased 5-year implied inflation to 3.13%. Most of the increase was absorbed by a decline in the 5-year TIPS yield to -1.95%, and the remainder allowed for an increase in the 5-year nominal yield to 1.18%. A portion of expected inflation was also priced in the 10-year yields, but a smaller amount in the 20 and 30-year maturities. With nominal yields along the curve distorted by implied inflation, the yield spreads of the 30-less-10-year narrowed significantly, creating an illusion of a forecast for an economic slowdown. In reality, the economy is on the verge of significant expansion.
Chart I
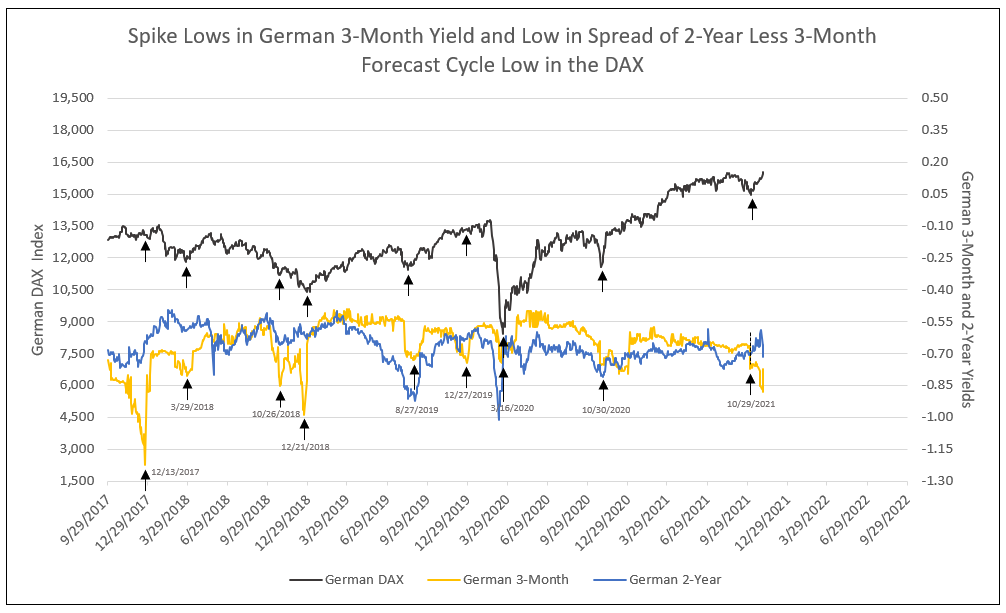
Chart II
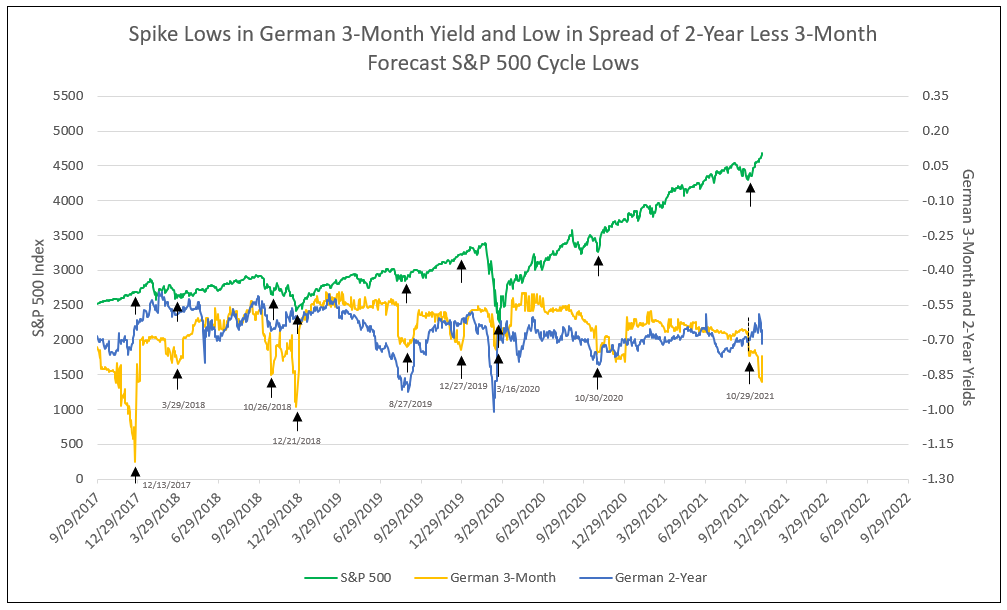
Chart III
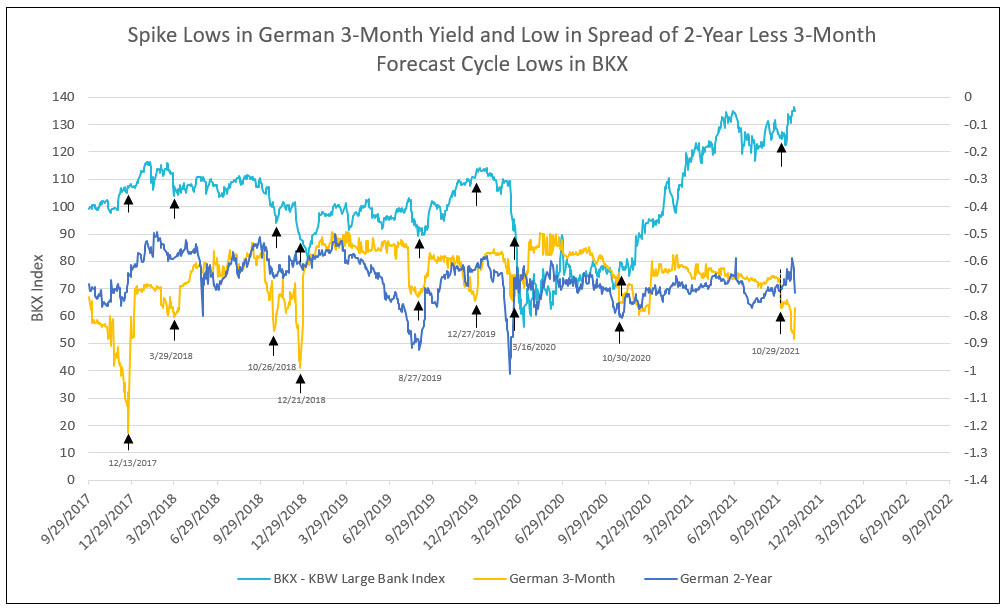
Chart IV
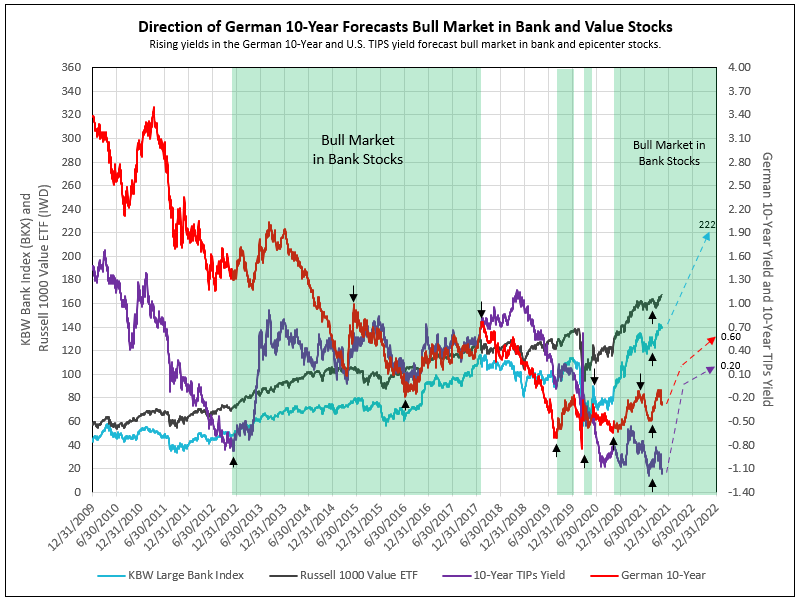
Signals from the German 10-year yield and TIPS yields, coupled with the affirmation provided by cycle low spikes in the German 3-month yield, indicate buy and sell dates for the BKX, QQQ and S&P 500 indices (see Table II).
Table III illustrates the periods of banks outperforming the QQQ and S&P 500 in the bank stock bull market from 12/10/2012 to 2/15/2018 and 10/29/2020 to date. The problem period from 2/15/18 to 10/29/2020 was caused by dramatic reductions in German yields in response to U.S. tariffs in Europe and China, followed by the advent of Covid.
Table II
German 3-Month, German 10-Year, and U.S. 10-Year TIPS Yields Determine Buy and Sell Dates
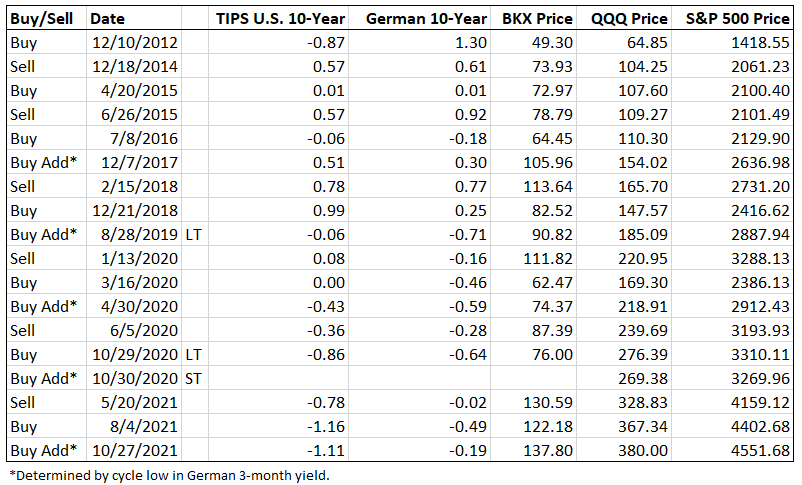
Table III
Buy and Sell Dates Based on German 10-Year, 10-Year U.S. TIPS and German 3-Month Yields
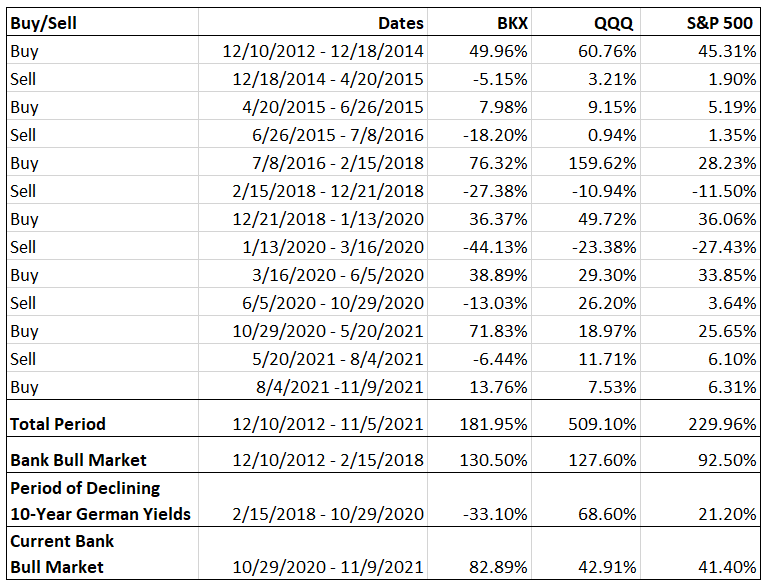
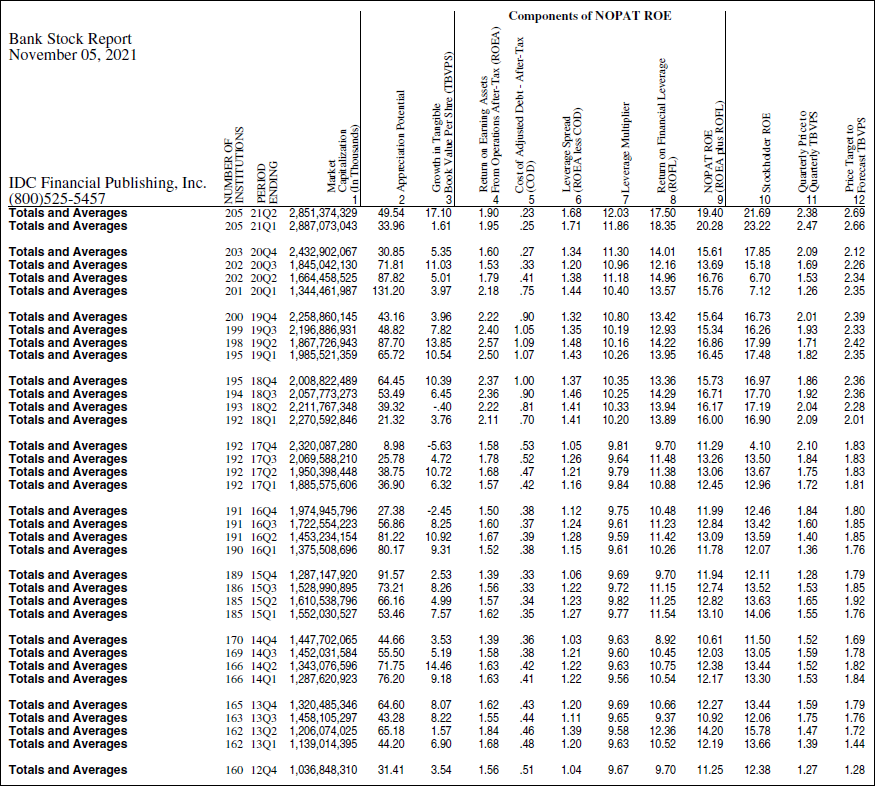
Table IV
Financial History of Bank Stocks
Proof of Valuation Method
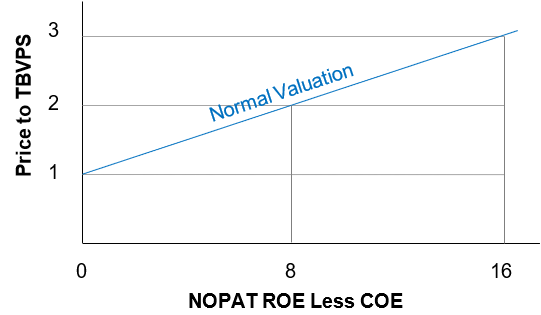
The valuation of a bank stock requires the multiplication of the spread of NOPAT ROE less the cost of equity capital (COE) times 0.125, then added to the value of 1 (the initial Price-to-TBVPS ratio). COE equals the forecast of the 30-year T-Bond yield (3%) plus ½ of that yield times the specific risk factors of an individual bank.
As an example, a ROE equal to COE indicates a valuation of 1-times TBVPS. A ROE of 13% and COE of 5% provides a spread of 8%, times 0.125 equals 1, plus base value of 1, indicates the bank would sell at 2-times TBVPS. A ROE of 21% less COE of 5%, or spread of 16%, times 0.125 equals 2 plus 1 base value, or a normal price of forecast 3-times TBVPS.
Chart V
Normal Valuation Line Reached Full Valuation in February 2018 and December 2019
The history of bank stock valuation, provided by appreciation potential of bank stocks from 2012 to 2021 demonstrates its accuracy. The major bull market in bank stocks began on December 12, 2012, and lasted to February 15, 2018, with the KBW Large Bank Index appreciating 130.5% over that 5-year, 2-month period, or 17.4% a year.
For the average bank stock, numbering 160 in 2012 to 192 in 2018, the average capitalization weighted 12-month appreciation potential, based on IDC’s valuation, began at 31.4%, rose to a peak of 91.6% in 2015, and ended in 2017Q4 with only a 9% appreciation potential, an indication of full valuation. A second valuation measure, current price to forecast TBVPS versus forecast price to forecast TBVPS (columns 11 & 12 in Table IV), provided a favorable spread from 2012 to 2017, but by year-end 2017 current price to TBVPS exceeded forecast price to TBVPS, indicating full valuation.
The current bank stock bull market began on October 29, 2020, with a 71.8% appreciation potential for the average bank stock. Despite an 83% appreciation in the KBW Large Bank Index from October 29 to November 9, 2021, another 60% appreciation potential in the BKX is forecast over the next 12 months. The current bull market could well offer the same or greater opportunity seen in the long bank stock appreciation from 2012 to 2018.
See other recent articles published by IDC discussing how:
- Bank financial history illustrates a secular increase in profitability and
- The German 10-year forecasts bull markets in bank stocks.
To inquire about IDC’s valuation products and services, please contact jer@idcfp.com or info@idcfp.com or call 262-844-8357.
John E Rickmeier, CFA
President
Robin Rickmeier
Marketing Director