How the German 10-Year Yields Forecasts the Beginning and End of Bull Markets in Bank and Value Stocks
Update as of December 6, 2021
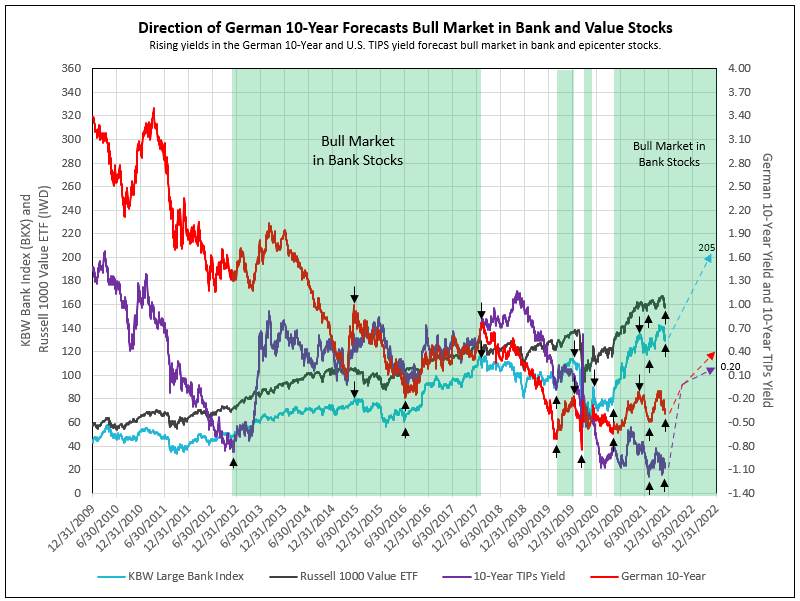
Over the last decade, the first bull market in bank stocks began on December 10, 2012, with the U.S. 10-year TIPS yield low of -0.87%. This bull market lasted 5 years and 2 months, ending on February 15, 2018, with a peak in the 10-year TIPS yield. The KBW Large Bank Index (BKX) rose 130.5%, compared to the Russell 1000 Value ETF increasing 65%. In this article, IDC Financial Publishing (IDC) will demonstrate how to determine the beginning and end of bank stock bull markets, what causes an intermission between bull market legs, and that banks dramatically outperform the average value stock during these bull market periods (see Chart I).
Bank stocks are driven by changes in the nominal 10-year yield. Implied inflation, the difference between the nominal 10-year and the U.S. Treasury Inflation Protected Security (TIPS), is relatively constant, normally varying between 2% to 2.5%. TIPS yield is driven by the nominal yield less implied inflation. To better understand the nominal yield impact on bank stocks, IDC initially relied on turning points of the 10-year TIPS yield with historic cycle lows below -0.80%.
Prior to 2014, the U.S. TIPS yield was dominant as the German 10-year yield remained at a premium, declining from its 2010 peak of 3.4% to the level of the U.S. TIPS yield by the end of 2014. This was due to the German government attempting to make their economy more competitive by reducing the yield on the 10-year and other short-term yields.
During the 2012 to 2018 bank bull market, the U.S. TIPS and German 10-year yields moved together from December 2014 to early 2018, as illustrated in Chart I. In the 12 months between June 26, 2015, and July 8, 2016, an intermission in this bull market took place. The German 10-year peaked at 0.92% on June 26, leading the peak in the TIPS by days as it finally peaked on July 13, 2015. This is important to note, as the German 10-year from this point forward dominates the TIPS yield in forecasting the timing of bull markets in bank stocks.
During the bull market intermission from June 26, 2015, to the cycle low on July 8, 2016, the German 10-year declined from 0.92% to a negative 0.18%, or 110 basis points, and the bank stocks measured by the BKX fell 18.2%, while the value ETF declined only 2.6%. This further illustrated the risk in bank stocks created by the large decline in German yields.
The second leg of the bull market lasted 19 months from July 8, 2016 to February 15, 2018 and ended with a peak in the German 10 year at 0.76%. The BKX bank stock index rose 76.3%, while the value ETF increased only 18.5%. This is important to point out since today we expect the BKX index to appreciate 53% to year-end 2022, less than the 76% experienced during the second leg of the 2012-2018 bank bull market.
While the German yield peaked in February 2018, U.S. 10-year TIPS yields continued to increase for many months to its peak of 1.17% on November 7, 2018. Bank stocks fell into a bear market in February 2018, declining 20% from the peak in 2018 to August 28, 2019.
Why did the German yield again call the downturn in bank stocks in early 2018? The German economy was highly dependent on auto and parts production and the export of these and other durables to China. The advent of tariffs by the Trump administration on Chinese goods reduced the purchases of autos in China, which in turn reduced German exports, income, and jobs. Germany responded to the tariffs similar to their controlled yield reductions from 2010 to 2014, driving yields lower from 0.76% in early 2018 to low of -0.71% on August 29, 2019, a decline of 147 basis points. Bank stocks finally responded to the cycle low in German yields by August 2019, kicking off the next bull market in bank stocks.
The bull market in bank stocks began August 28, 2019 and ended with a peak in the German yield at -0.16% on January 13, 2021, followed by a sharp decline in yields for the remainder of the month of January (possibly foreseeing the advent of Covid). For whatever reason, the peak in German yields called the end of the short bull market in bank stocks with the BKX appreciating 23%, while the value ETF rose 11.7%.
It is understood that Covid caused the bear market in stocks during early 2020. Following the March 23,, 2020 low in bank and value stocks, along with the remainder of the stock market (successfully called by Tom Lee of Fundstrat), the German yield failed to bottom until April 30, 2020 at -0.59%. The recovery in that yield was short with the German yield peaking at -0.27% on June 5, 2020. Bank stocks rallied 17.5% in that short period, while value stocks appreciated 11.3%.
German yields declined in an irregular manner from June 5 to October 29, 2020, with the 10-year reaching a low of -0.64%. The U.S. TIPS yield also fell to -0.91%, and bank and value stocks both failed to perform in this period, as growth and tech stocks led the market.
The next bull market in bank stocks began on October 29, 2020. The BKX was at its cycle low of 76 on October 29 and increased to 130.6 on May 20, 2021, for a gain of 71.8%, while the value ETF rose 36%, forming the first leg of the current bank bull market. Then on May 20, the German 10-year peaked at -0.11%, calling an intermission and an end to this first leg.
The intermission lasted from May 20 to August 4, 2020, as the German yield declined to -0.49% and the BKX fell 6.4%. The value ETF was flat during this period. On September 20, the BKX retested the August 4 low with a higher German yield at -0.33%, further supporting the case for an end of the intermission and the beginning of the next leg in the bull market in bank stocks. On September 27 and again on October 1 the BKX rose above its prior high of 131 from May 20 (the beginning of the intermission), confirming the next upward leg of the bull market.
IDC forecasts the second leg of the bull market in bank stocks to last into 2022 and 2023 or even longer. For the next 12 months, IDC forecasts a 53% appreciation potential for the BKX index of large banks from 134 to a target price of 205.
The German 10-year recently reached a new high of -0.09% and expected to rise to zero or above by year-end or early 2022, as Germany attempts to deal with extremely high energy inflation and economic recovery following the end of the Delta spike in Covid. The end of central banks buying sovereign debt in Europe, Japan, and the U.S., or tapering further increases the German 10-year yield toward a positive 0.20% by late 2022. The U.S. TIPS yield would then recover to zero, with an implied inflation of 2.4%, forecasting a nominal U.S. 10-year yield of 2.4% and a 3% long T-Bond yield in 2022. Further increases in 10-year yields later in 2022 and into 2023 bode well for a continuing bull market in bank stocks (see Chart I).
With the appearance of a new coronavirus strain, the stock corrected in late November 2021. Drug companies project vaccines to holdup again the omicron variant. JP Morgan strategists estimated the variant would accelerate the pandemic’s end. These are good reasons to buy bank stocks in the current correction. See IDC’s article Decline in German 3-Month Yield Triggers Bull Markets in Bank Stocks.
Chart I
Why TIPS Yield Below German 10-Year is Unsustainable
The U.S. 10-year TIPS yield is ready to launch from -1.11%. On October 9, the German 10-year rose to a new high of -0.07% with the next level at zero and then positive in 2022 (see Chart I).
The German yield was reduced by the German government to levels of the U.S. TIPS 10-year yield by early 2015 to make Germany more competitive. From early 2015 to early 2018, the two yields were nearly equal, since you are not able to reduce the German 10 year below the TIPS yield without major monetary stimulus. With the Fed funds rate increases in 2018 to 2019, coupled with reduction in German yields by the German government to offset the impact of tariffs, U.S. TIPS yields were much higher than the German. By the beginning of Covid in early 2020, the U.S. 10 year was 0.07% and the German was -0.16% on January 13, 2020. The advent of Covid reduced both yields to -0.44% on May 26, 2020.
In the subsequent period, bond purchases by the Fed coupled with a very weak economy due to fear of Covid significantly reduced nominal U.S. 10- year yields to a new low. Subtracting 10-year implied inflation drove the TIPS to a low of -1.08% by August 6, 2020. The German yield low on that date was -0.539%. Without major Fed monetary stimulus these two rates would be the same, but the Fed bond buying maintained this negative spread to December 31, 2020, lows of -1.08% on the U.S. vs -0.575% on the German.
From this point forward, Germany allowed their yield to rise toward zero. However, the Fed maintained its monetary stimulus. During the third quarter of 2021 and into October, weakness in final demand, due to Delta Covid fear, continued Fed’s stimulus, and massive short covering of longer term U.S. bonds held down nominal U.S. yields. Implied inflation rose, and the TIPS yield retested the low of -1.11%.
Tapering beginning in December reducing Fed stimulus, Delta continuing to recede, new Covid variants having limited impact, and the economy overcoming the supply shortages (resulting in a peak in implied inflation), together forecast a rise in real U.S. TIPS yields of 100 basis points or more to the level of the German yield by year-end 2022, as nominal 10-year yields in the U.S. are no longer depressed by external factors (see chart above).
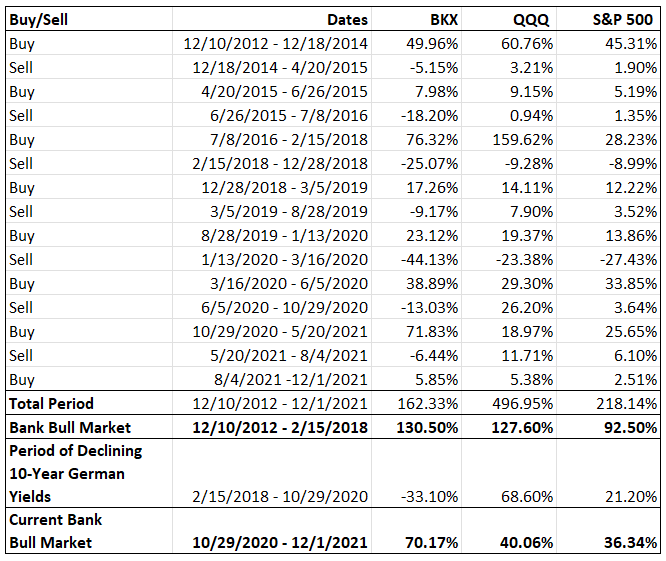
Table I
German 3-Month, German 10-Year and U.S. 10-Year TIPS Yields Determine Buy and Sell Dates

Table II
Buy and Sell Dates Based on German 10-Year, 10-Year U.S. TIPS and German 3-Month Yields
To inquire about IDC’s valuation products and services, please contact jer@idcfp.com or info@idcfp.com or call 262-844-8357.
John E Rickmeier, CFA
President
Robin Rickmeier
Marketing Director