Copper to Gold Ratio Rises to 0.30 as Gold Price Declines Due to a More Deflationary Outlook, Forecasting 2.0% to 2.5% Yield on 10-Year U.S. Treasury Notes
Yardeni Research plotted the price of copper with implied inflation (the difference between the 10-year nominal and TIPS yields). Since 2004, once implied inflation reached a peak, the price of copper failed to reach a new high. Given the recent peak in implied inflation of 3%, the price of copper fails to rise above $4.77 and forecast to recede to $4.20 in 2022 (see Chart I).
Chart I
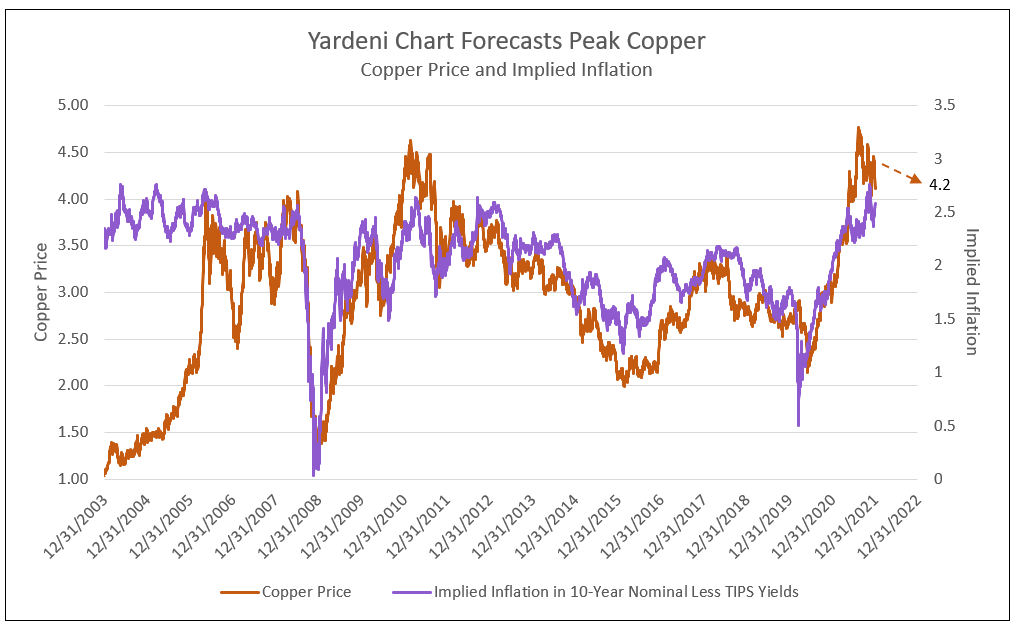
Chart I Source: Yardeni.com
The copper to gold ratio rose to 0.30 to 0.35 and above in IDC Financial Publishing’s (IDCFP) recent forecast, partly due to an estimate of $5.50 for the price of copper. Given a more deflationary outlook based on the Yardeni Research, the copper to gold ratio forecast of 0.30 becomes dependent on a decline in the price of gold toward $1,400 (see Chart II).
See our recent article detailing the copper to gold ratio forecast here.
Chart II
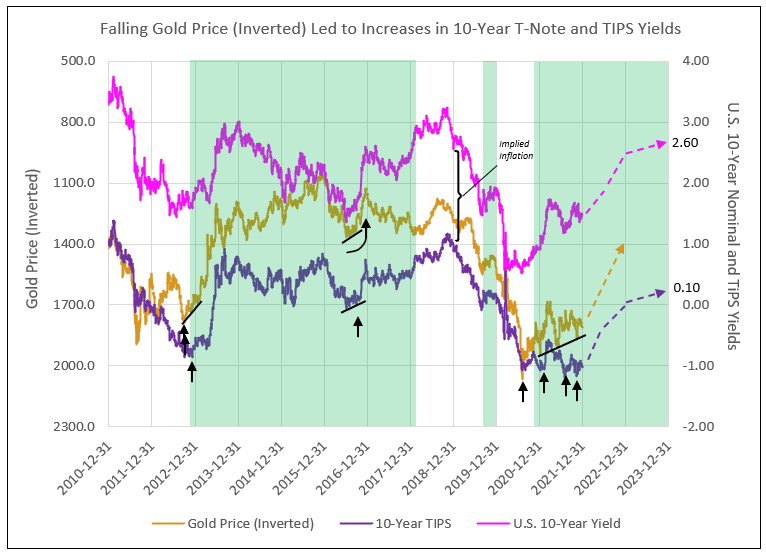
Chart III illustrates the price of gold (inverted) relative to the nominal and TIPS 10-year yields. Yardeni noted in 2013 that the decline in the gold price (inverted), from its peak of $1,789 in 2012 to $1,190 in 2013, led the dramatic rise from -0.8% to +1.0% in the 10-year TIPS yields in 2013 and, therefore, the nominal yield addition of more than 1% to a peak of 3%.
The same pattern exists today, as the price of gold (inverted) has lower peaks (see trend line in Chart II), forecasting a potential significant rise in the 10-year TIPS yield and, therefore, the nominal yield.
Chart III
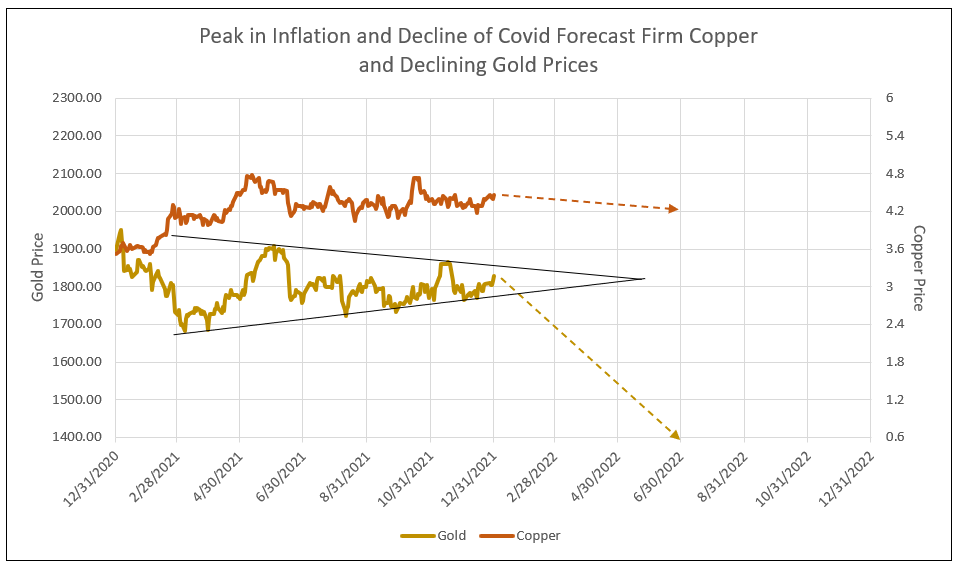
The price of gold (inverted in Chart II) declined from over $2,000 to a low of $1,680 and currently trades at $1,800. A peak in inflation expectations as copper remains in the $4.00 to $4.80 range forecasts gold to decline below $1,680 to new cycle lows. Looking at history, gold could again decline to a low of $1,400 in 2022 (see Charts II and III).
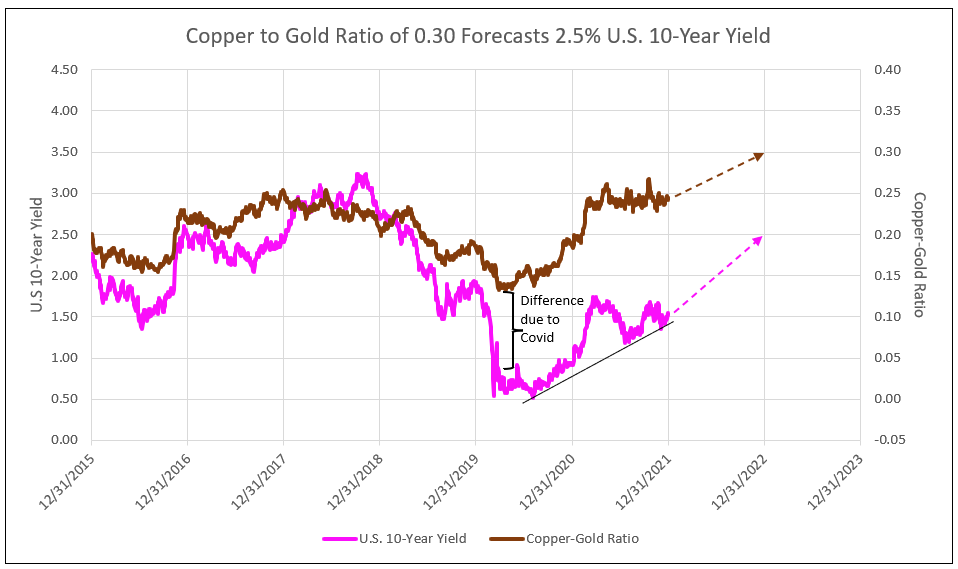
In a more deflationary outlook, the TIPS yield increases from -1.0% toward zero, implied inflation narrows from 2.7% toward 2%, and the nominal 10-year yield increases to 2% during 2022, reaching 2.5% at year-end.
Chart IV
The Bull Market in Bank Stocks Continues
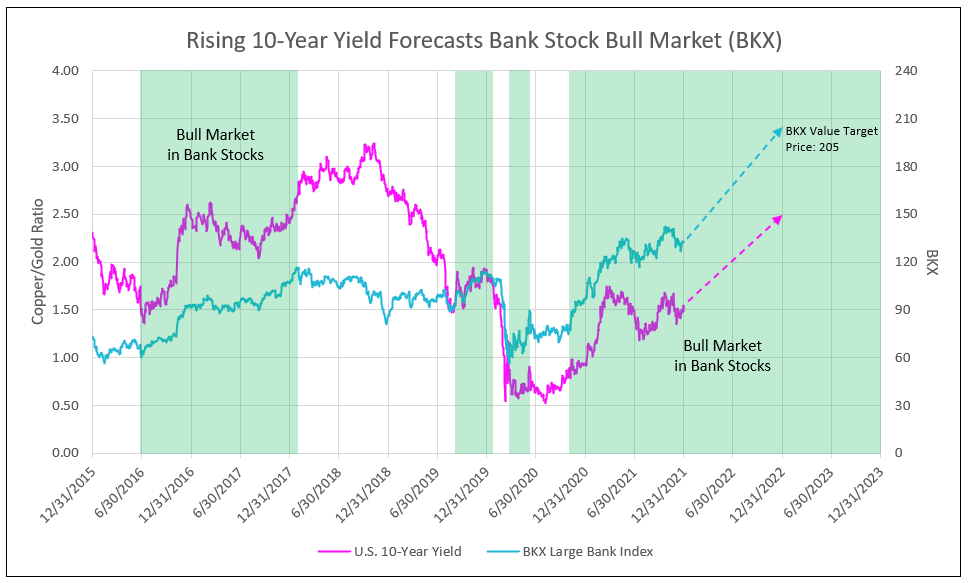
The KBW large bank stock index (BKX) is plotted with the copper to gold price ratio (Chart V) and with the 10-year yield (Chart VI). With or without stronger inflation (and even with deflation toward 2%), the ratio of copper to gold rises to 0.30 to 0.35 and 10-year yield increases to 2.0 to 2.5%.
In both charts V and VI, there is a continued rise in the BKX to 205 for a 53% appreciation potential consistent with a 0.30 to 0.35 copper/gold ratio or a 2.0 to 2.5% 10-year yield forecast.
Chart V
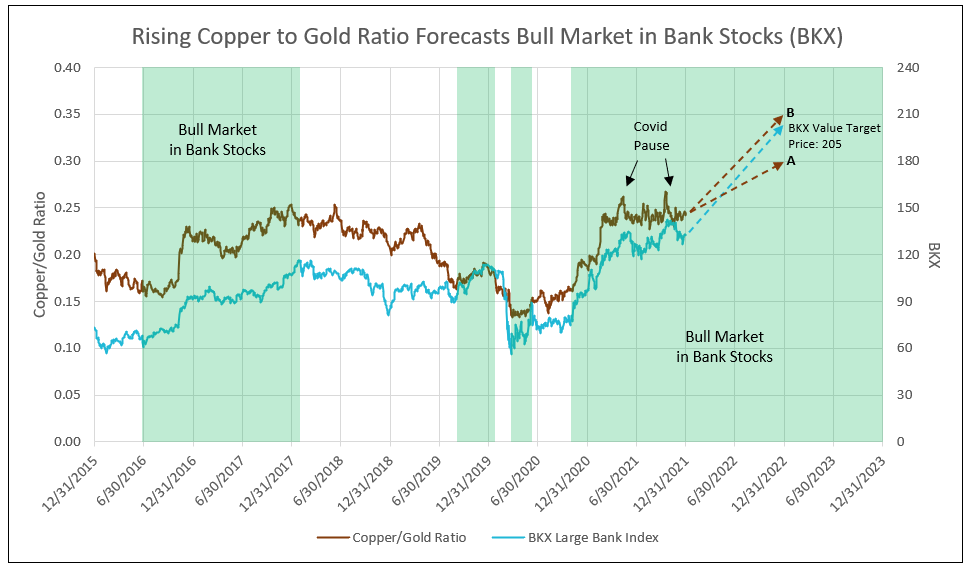
- A: Current deflation forecast based on $4.00 copper and $1,400 gold prices.
- B: Last week inflation forecast based on $5.50 copper price and limited decline in gold.
Chart VI
To view all our products and services please visit our website www.idcfp.com. For more information about our ranks, or for a copy of this article, please contact us at 800-525-5457 or info@idcfp.com.
John E Rickmeier, CFA
President
jer@idcfp.com
Robin Rickmeier
Marketing Director