January Peak in One-Month Trimmed Mean Core PCE Measured by Dallas Fed Forecasts Peak in 12-Month Inflation
Significant Decline in 1-Month Trimmed Core PCE Forecasts Peak in 12-Month in Second Quarter 2022 at Around 5%
Chart I
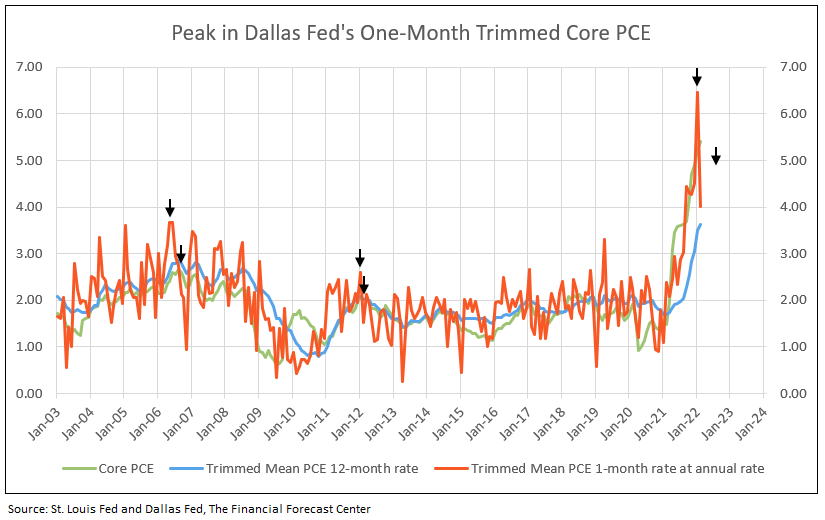
The Trimmed Mean PCE inflation rate is an alternative measure to sticky inflation in the price index for personal consumption expenditures less food and energy (Core PCE). It is calculated by staff at the Dallas Fed, using data from the Bureau of Economic Analysis (BEA).1
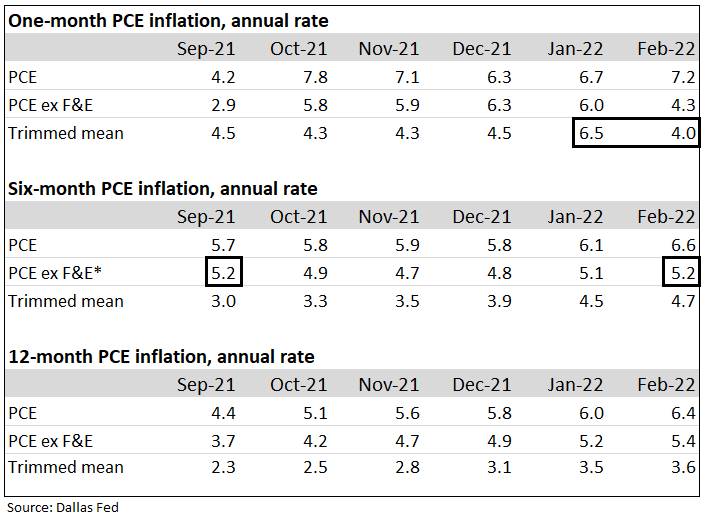
Note the six-month* Core PCE inflation in February 2022 was equal to September 2021 (see Table I). Inflation, therefore, moderates significantly in the second half of 2022.
Table I
Trimmed Mean PCE Inflation Rates
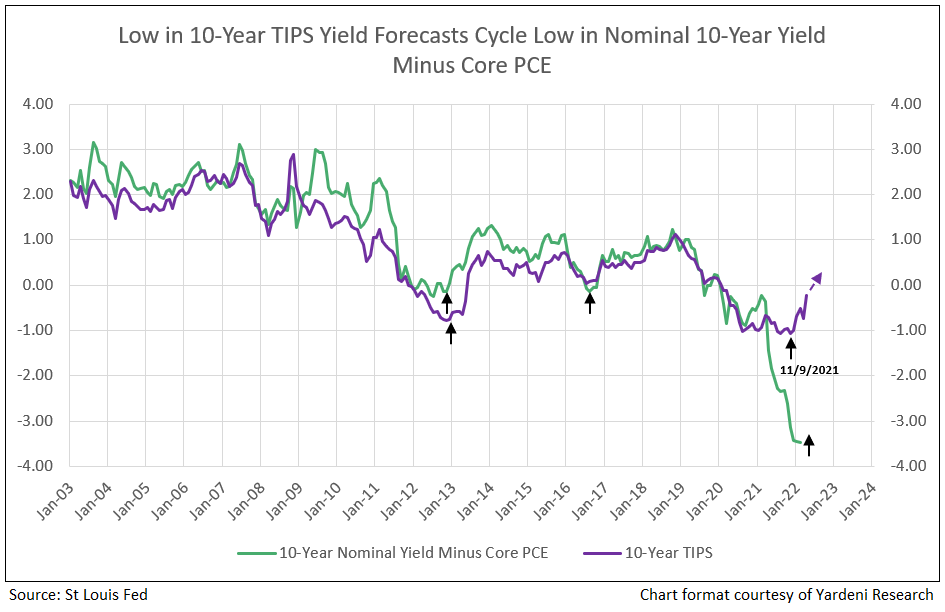
TIPS Yields Reach a Low and Recover Toward Zero
The cycle low in Treasury Inflation Protected 5- and 10-Year Yields (TIPS) is due to several reasons.
- The Russian invasion of Ukraine caused volatility in the markets, particularly with 5- and 10-year TIPS yields declining, reaching a low on March 11, but above the previous lows on November 9, 2021.
- The Federal Reserve is expected to raise the Fed funds rate to a minimum 2%+ in eight or more quarter-point increases in 2022 and/or early 2023, and to possibly over 3%.
- The Fed will reduce the size of its balance sheet $95 billion a month in 2022, beginning in May.
- The temporary lifting of the debt ceiling allows issuance of U.S. debt by the Treasury, increasing supply of new debt.
The yield on the 10-year is expected to increase to 2.8% by mid-year and to 3.0%+ by year-end 2022, as the TIPS yield increases toward zero followed by a decline in implied inflation.
What About Inflation?
The 10-Year yield minus the core PCE inflation rate reached its most negative point and reversed, as forecast by TIPS yields reaching its low on November 9, 2021 and recovering (see Charts II & III).
The corporate bond market confirms the forecast from U.S. Treasury TIPS yields with the ratio of the investment grade bond ETF (LQD) to the high yield bond ETF (HYG) declining to new cycle lows, indicating the appetite for risk and buying of epicenter stocks as HYG outperforms and inflation peaks (see our article about structural change in the bond market from February 28, 2022).
Bloomberg Economists stated on March 4, 2022, based on analysis of the February job report, “The easing of labor shortages appears to be starting to slow the pressure on wages, which could provide a glimmer of support to the optimists in the FOMC that inflation might come down later this year.”2
However, increases in oil prices impact inflation because they affect vital components of the economy like transportation, manufacturing, power generation, chemicals, and materials. The measured effect, according to J.P. Morgan’s chief economist Bruce Kasman, is that a 10% increase in the price of oil removes 0.2% from global growth and adds 0.3% to the CPI.
Fundstrat’s Tom Lee also pointed out on March 7, 2022, that Brent crude oil surged to $130, but is still only 3% of the consumer wallet, below 4.5% in 2008 and 6.5% in 1980.
Inflation, like oil prices, is in backwardation3. Brent oil today is $101, with December futures at $96 and April at $93. WTI U.S. Crude Oil fell below $100 a barrel, down from a peak of $125.
Truck freight rates are down 35% in March due to a huge return to employment of drivers and lower demand. Previous high freight rates were a surcharge on consumers and other goods, which is now significantly diminished.
The number of used vehicles sold in March fell by 15% from March 2021, according to estimates from Cox Automotive. March wholesale prices of used cars that were sold at auction fell 3.3% from February, according to the Manheim Used Vehicle Value Index. In January wholesale prices were flat for the first time since August (seasonally adjusted). In February prices fell 2.1% and again fell 3.3% in March.
Low in 10-Year TIPS Forecasts Peak Inflation
The cycle lows in the 10-year TIPS yields in 2013, 2016 and November 9, 2021 forecast the cycle lows in the U.S. nominal 10-year yield minus the core PCE inflation rate (see Chart II).
Chart II
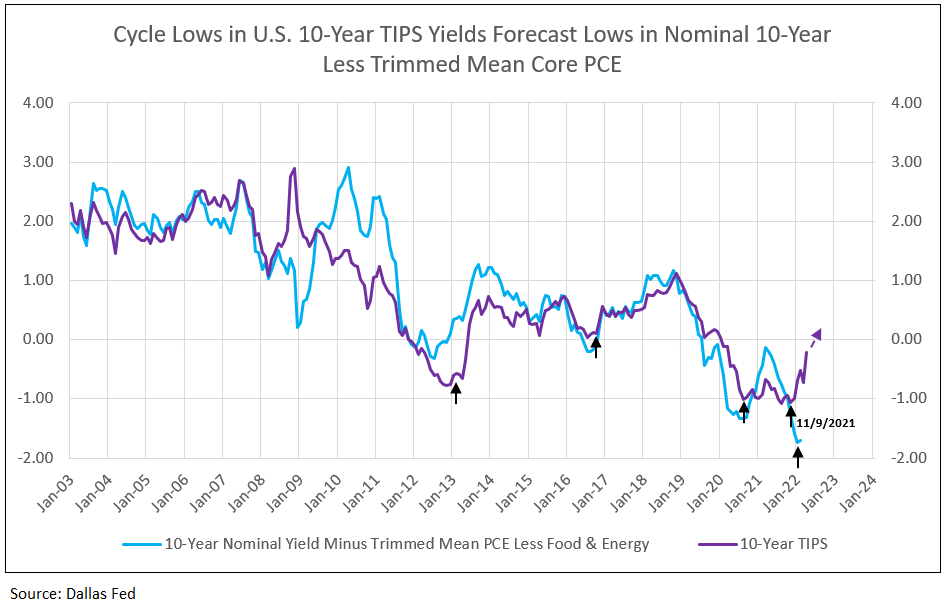
The cycle lows in the 10-year TIPS yields in 2013, 2016, 2020 and November 9, 2021 forecast the cycle lows in the U.S. nominal 10-year yield minus the trimmed mean core PCE from the Dallas Fed (see Chart III).
Chart III
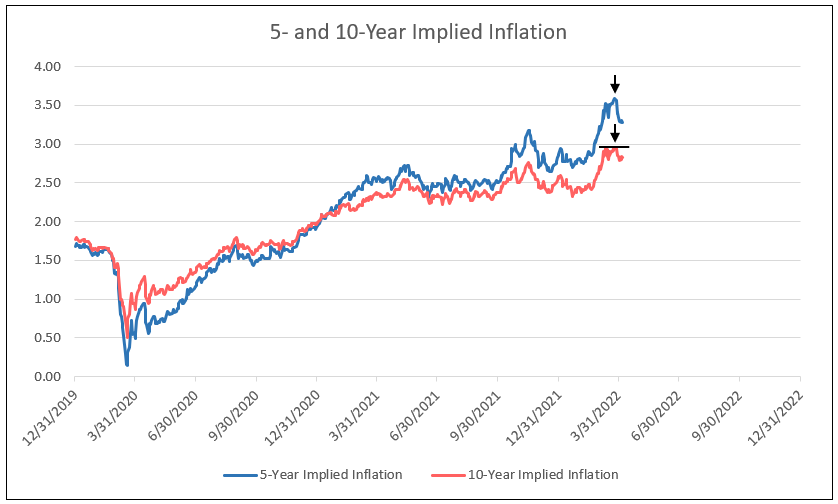
Implied Inflation Forecasts Inflation Peak
Implied inflation of the 5-year nominal T-Note less the TIPS yields reached new highs reflecting recent inflation reports and the Russian invasion of Ukraine. Implied inflation peaked in March 2022, following the peak in the Dallas Fed’s one-month trimmed mean core PCE. Declines in 5- and 10-year implied inflation readings in the second quarter of 2022 are assisted by a less-negative TIPS yields (see Chart IV).
Chart IV
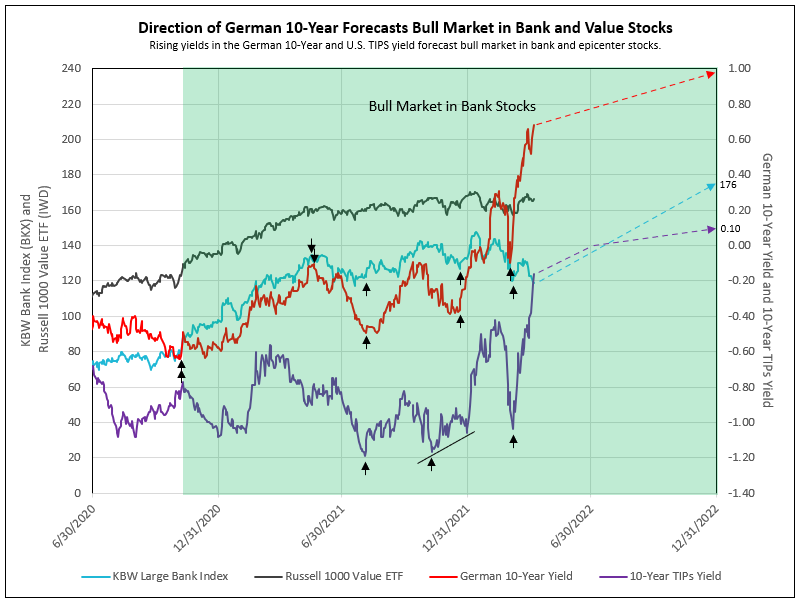
Bull Markets in Bank Stocks Continues, Following Fears of an Inverted Yield Curve and Forecasts of Recession
- The low in the 10-year TIPS yield at year-end 2012 began the 2012 to early 2018 bank stock bull market.
- Since 2015, the bull markets in bank stocks responded to the cycle low in the German 10-year confirming a low in the U.S. 10-year yield (see Chart V).
- The first leg of the current bull market in bank stocks began in October 2020 and paused for an intermission in mid-May 2021, due to the German 10-year yield reaching its peak of -0.11%.
- An intermission occurred between legs from May to July 2021, as the German 10-year yield declined to its cycle low.
- The next upward leg of the bank bull market began in July 2021.
- The recent volatility in the German 10-year yield is all due to the impact of Russia’s invasion of Ukraine. The yield went from a positive 0.31 and declined to a negative 0.07, then recovered to +0.02% and declined to -0.10, then followed up with a massive move to +0.71, This irregularity was reflected in the U.S. 10-year TIPS yield and the price of bank stocks, as represented by the KWB NASDAQ Bank Index (BKX). Despite the recent correction in bank stock prices, the substantial rise in the German 10-year yields strongly supports the forecast for a continuation of the bank bull market throughout 2022 (see Charts V & VI).
Chart V
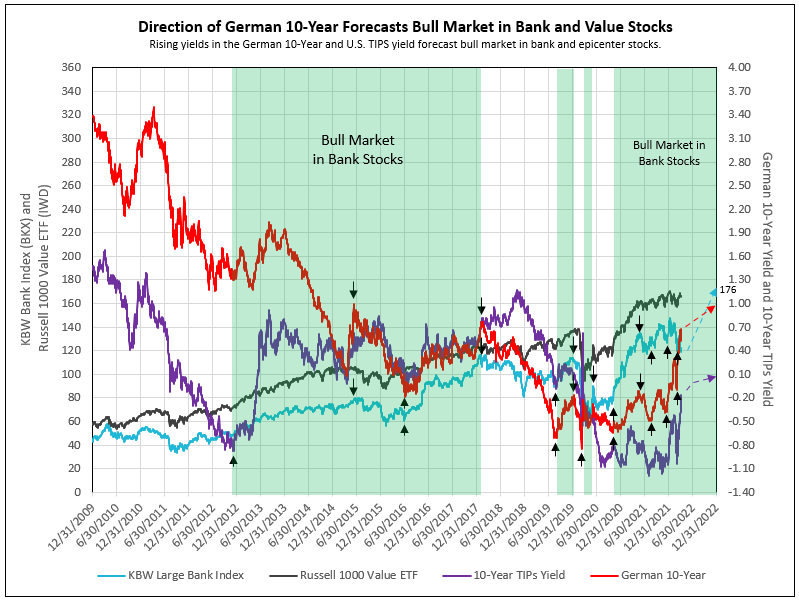
A breakout in the 10-year U.S. TIPS yield to a negative 0.22 confirms declining implied inflation, the significant rise in the German 10-year yield, and the continuation of the bank stock bull market (see Charts V & VI).
Chart VI
Technical Analysis Indicates a Buy Signal on Bank Stocks and a Sell Signal on Oil and Commodity Stocks
- Exxon and other oil stocks have a DeMark 13 sell signal.
- DB Commodity Index ETF have a DeMark 9 sell signal followed by a 12 with 13 confirming the sell.
- KBWB - KBW Bank Index ETF, as well as JPM, GS, MS, BK, FBP and WAL, all have a DeMark 13 buy signal. The vast majority of the thirty stocks held in IDCFP’s bank stock portfolio, as well as the KRE, were on a countdown of 8, with 9 being a buy DeMark signal.
- HYG High Yield Bond ETF favors reopening and outperforms LQD, or high-quality bond ETF, with the latter having a major overbought condition.
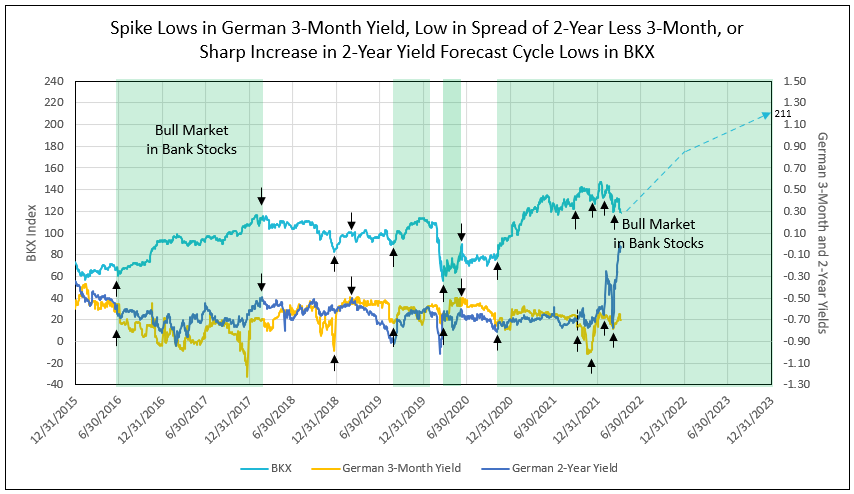
The late 2021 and first-quarter 2022 cycle lows in the German 3-month and 2-year yields provided buy adds to bank stocks (see Chart VII).
Chart VII
According to Ed Yardeni, president of Yardeni Research, “The Fed aims to tamp down inflation without igniting a recession; investors are skeptical, but we expect inflation will moderate later this year, bringing the doves back.”4
1 - The Federal Reserve Bank of Dallas
2 - U.S. Job Gains Accelerate While Wage Growth Slows Sharply, Bloomberg
3 - 3 reasons why stocks could move higher in the face of an inverted yield curve, according to Fundstrat's Tom Lee
4 - Stocks Drift. Bonds Fall as Tough Week Nears End: Markets Wrap, Bloomberg
To view all our products and services please visit our website www.idcfp.com. For more information about our ranks, or for a copy of this article, please contact us at 800-525-5457 or info@idcfp.com.
John E Rickmeier, CFA
President
262-844-8357
jer@idcfp.com
Robin Rickmeier
Marketing Director