Credit Unions Prepare for Recovery
IDC Financial Publishing, Inc.’s (IDCFP) nontraditional approach to analyzing financial ratios offers a unique perspective to understand a credit union’s level of risk and profitability. Credit unions are compared over time with financial ratios (see attached table Credit Unions National Totals). Using this method, you can also get a similar report with a forecast of profitability for your institution.
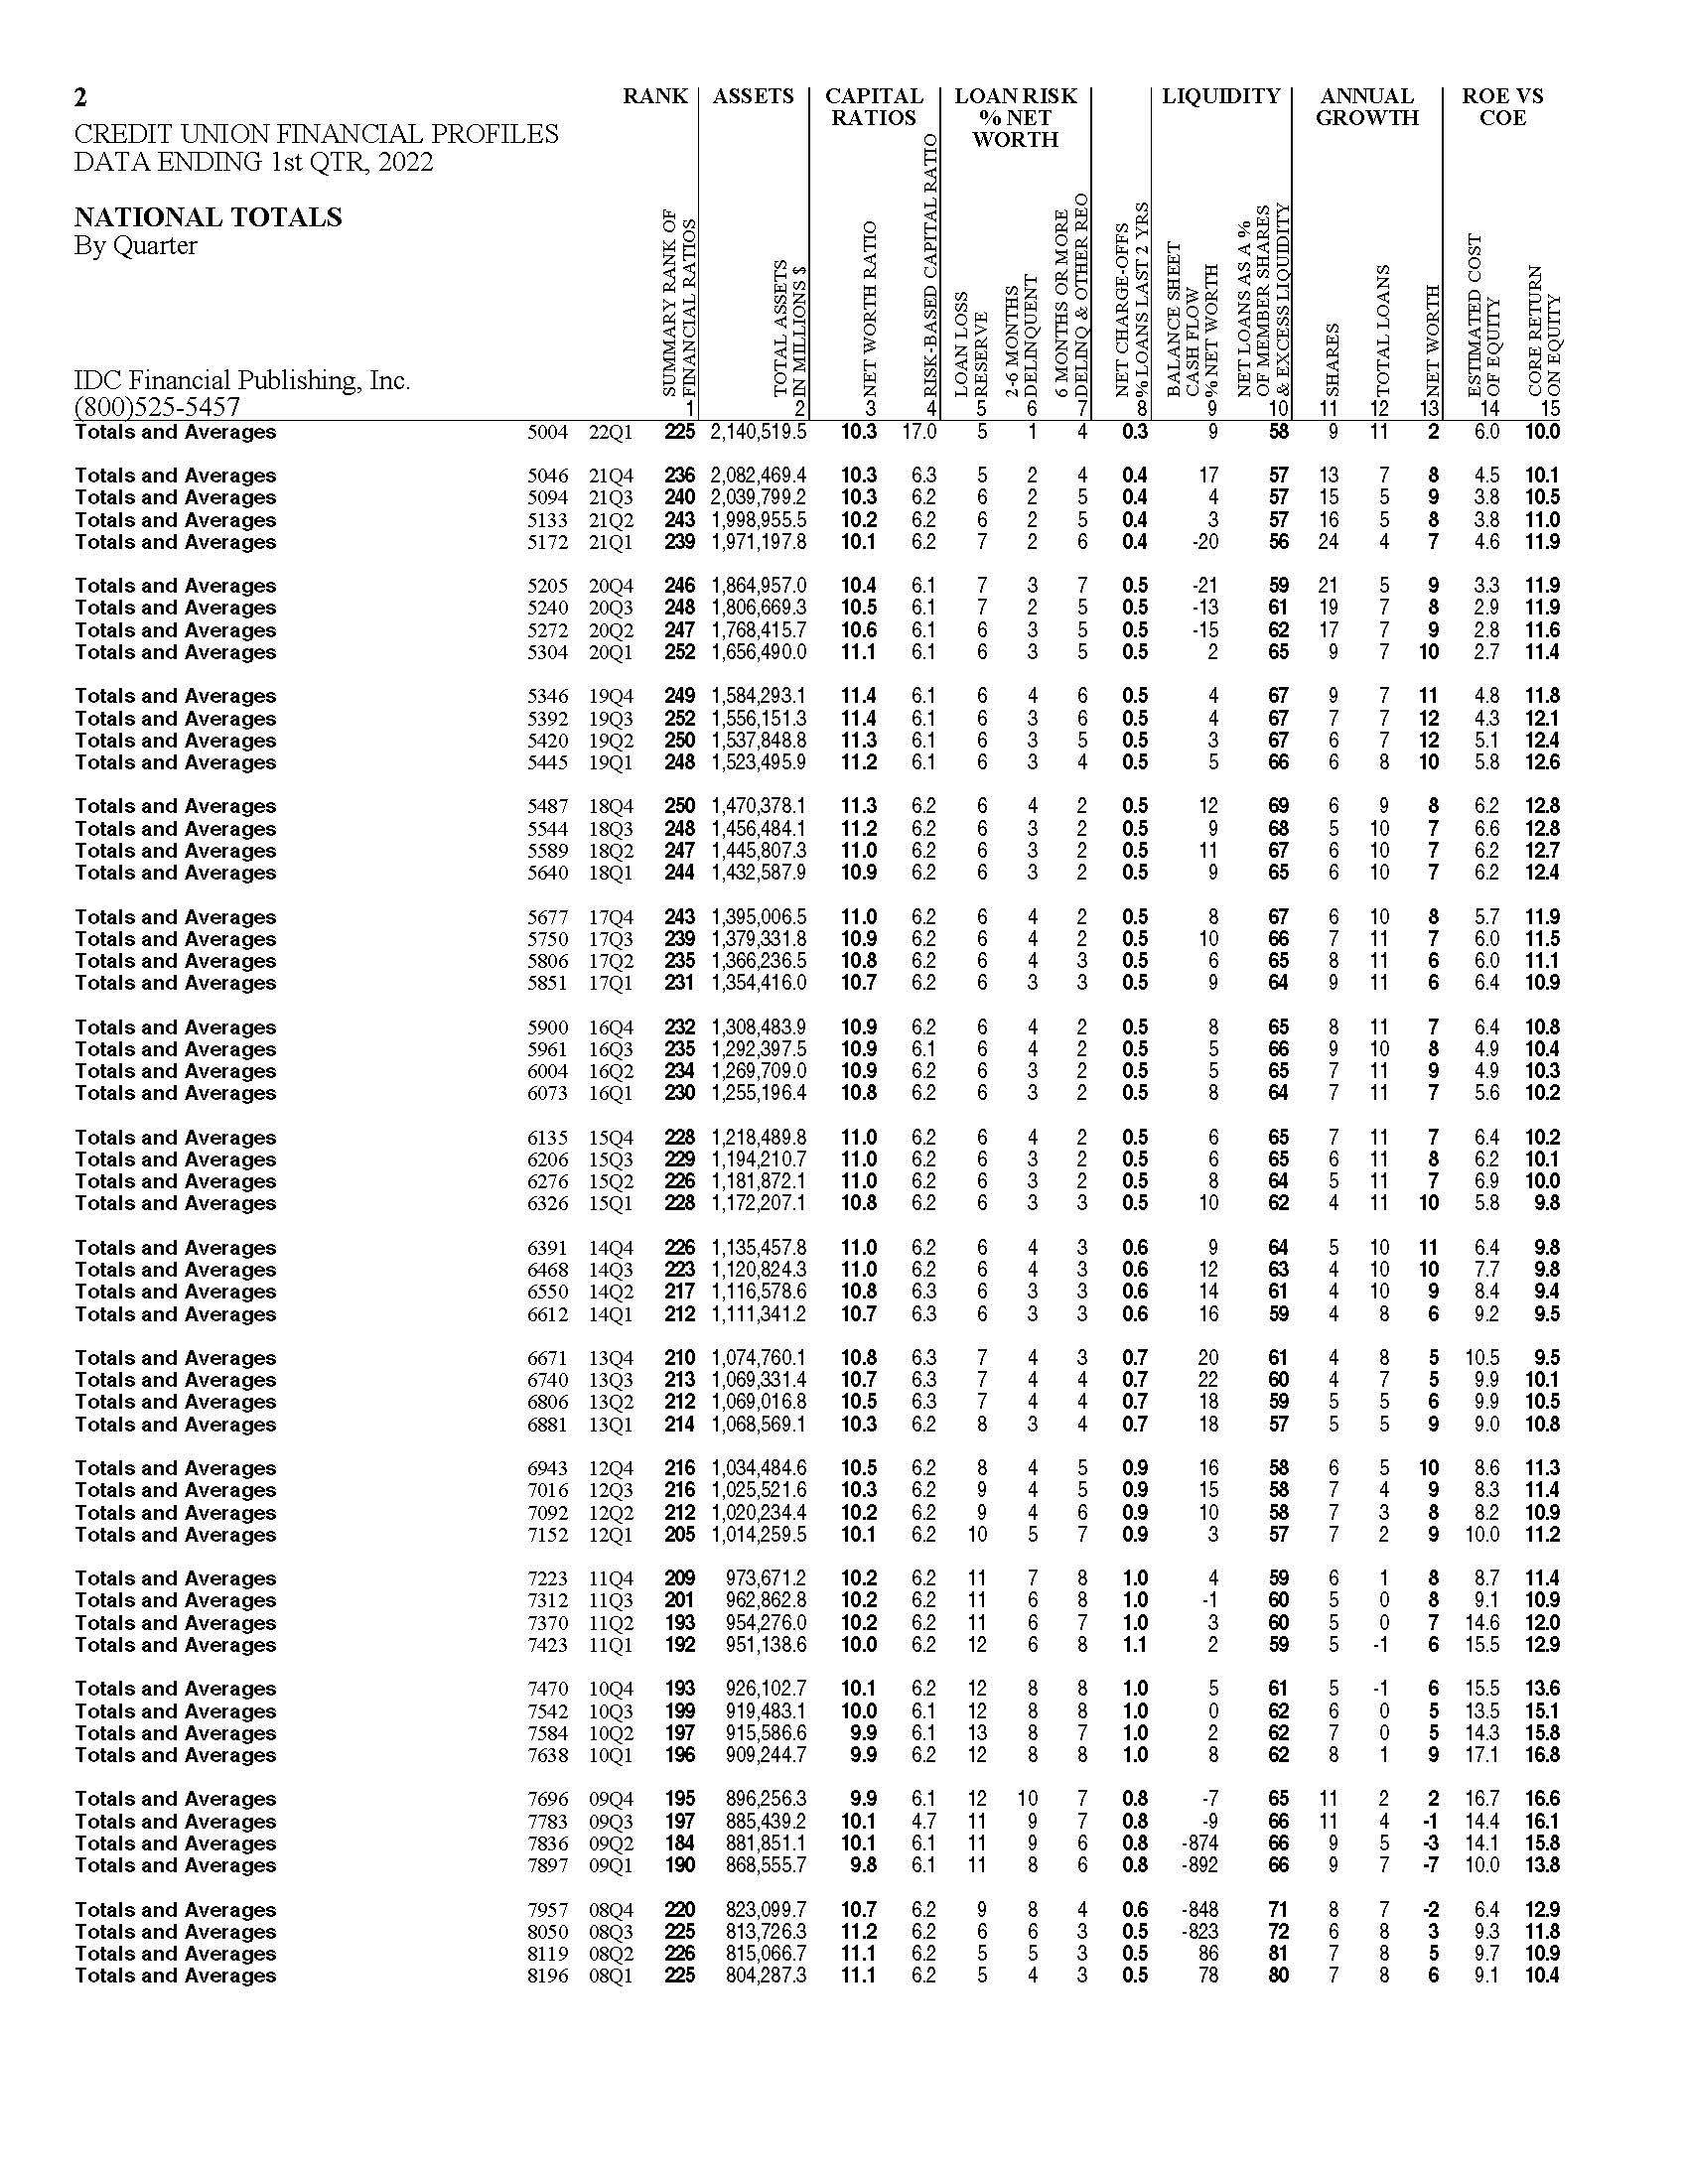
The foundation of a credit union is its net worth capital as a percent of total assets. This ratio peaked at 11.4% as of December 31, 2019 and declined to 10.3% as of March 31, 2022 (Column 3, CU National Totals). Loan delinquency as a percent of net worth remained under control with net charge-offs declining on trend (Columns 5, 6, 7, & 8, CU National Totals). Due to the Covid pandemic, however, net loans to shares and borrowings declined from 67% in 2019Q4 to 58% in 2022Q1. The strategy employed by most credit unions over recent years seems to be building liquidity and increasing capacity to support stronger loan demand with higher loan yields in a potential economic recovery.
Financial strength of a credit union over time depends on the net worth ratio complimented by a favorable return on equity (Columns 2 and 15). Return on equity (ROE) peaked in 2018 at 12.8%, fell to 11.8% in 2019Q4 and declined to 10% by 2022Q1. Given an economic recovery in 2023 and 2024, with higher loan yields on stronger loan growth, ROE is expected to recover to 12% or higher. To understand credit union recent history and the forecast, IDCFP examines the financial ratio components of ROE, which are all rolling 12-month averages.
The Traditional ROE or ROA Equation and the Problems with the Financial Analysis of a Credit Union
The traditional ROE equation simply divides net income by the average of equity capital. The return on equity (ROE) or return on assets (ROA), as a bottom-line measure of profitability, fail to reflect the true nature of asset value. In addition, the traditional components of the ROE – net interest margin, net income return on assets (ROA), and resulting ROE – confuse the source of net income by subtracting cost of funding so early in the analysis. Evaluation of a credit union is unable to separately compare operating and financial returns. Lastly, not adjusting net income for the increase on the loan loss reserve, fails to reflect the true cash flow to earnings.
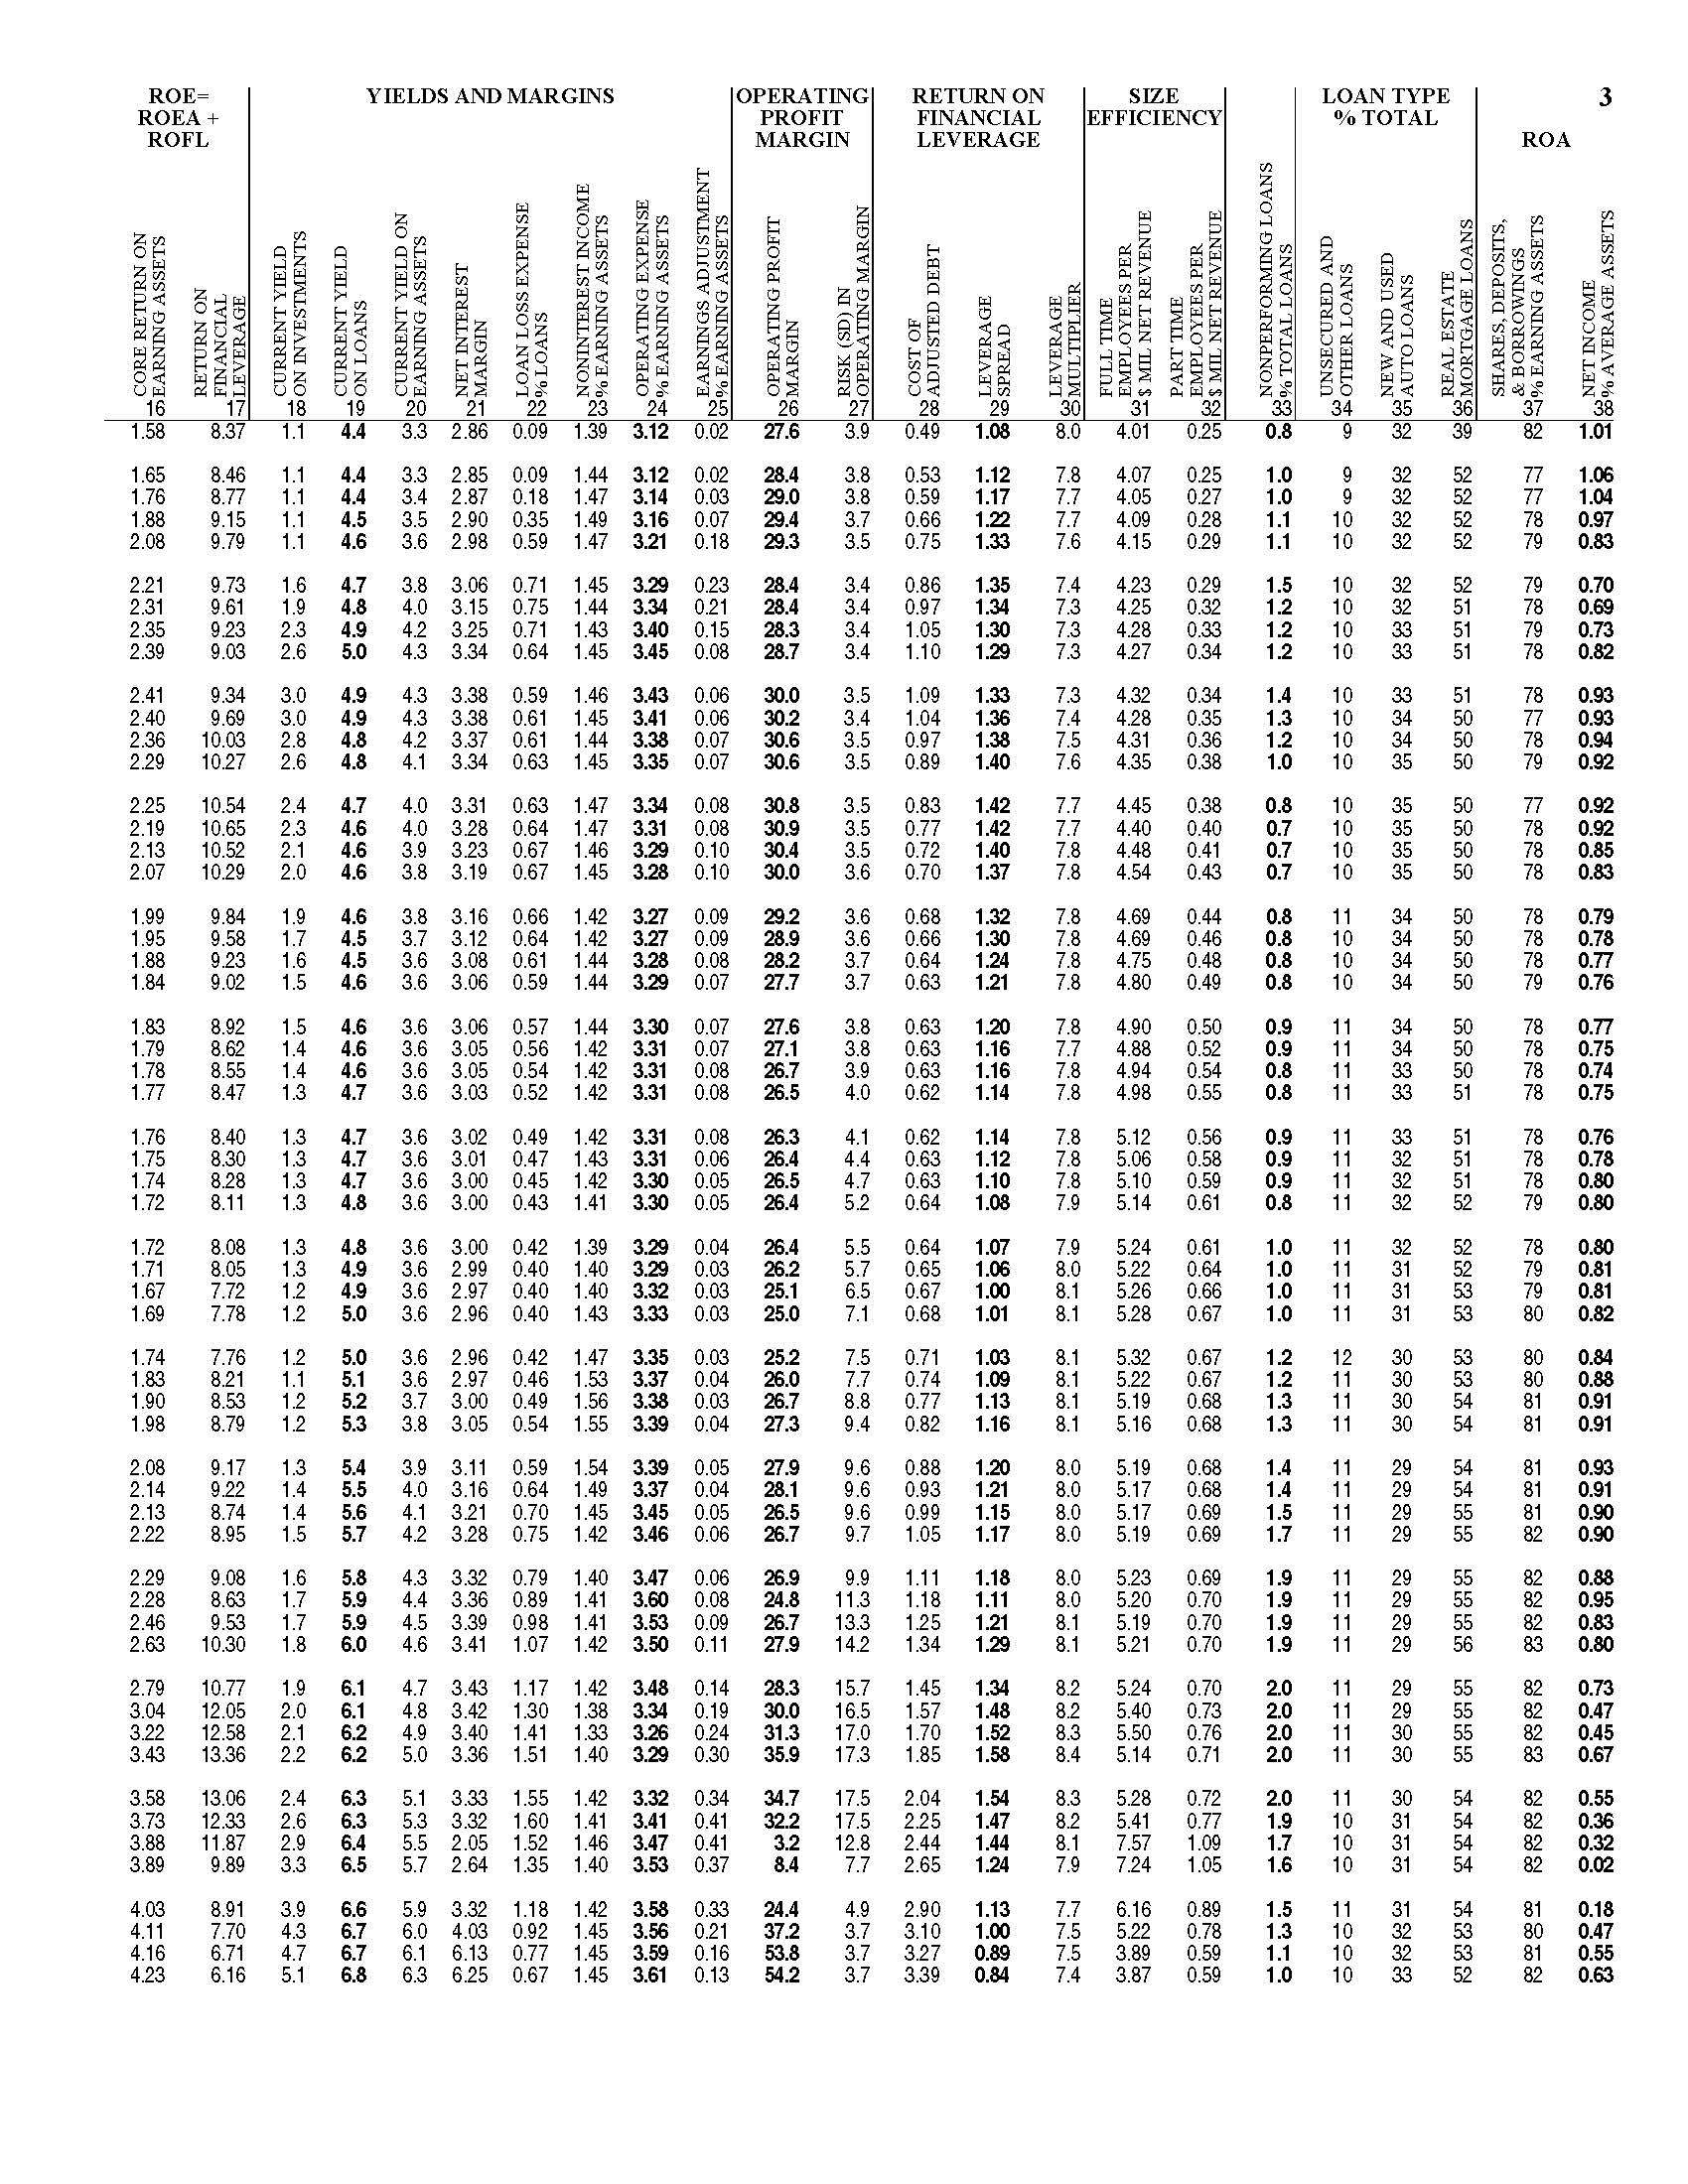
As an example, with the traditional equation, credit union average ROA rose from 0.93% as of December 31, 2019, to 1.01% by March 31, 2022 (Column 38). Yet, IDCFP’s calculation of ROE substantially declined as did the operating profit margin over the same period.
Return on Earning Assets (ROEA), A Measure Operating Returns
To measure success in the operating return of a credit union, return on earning assets (ROEA), combines revenue from interest and noninterest sources less operating expense (excluding interest expense) and adds the increase in the loan loss reserve (to measure cash flow from operations), all divided by earning assets.
ROEA (Column 16) peaked at 2.41% in 2019Q4 and declined to 1.58% in 2022Q1. While loan yields remained stable (Column 19), noninterest income as a percent of earning assets fell from 1.46% in 2019Q4 to 1.39% in 2022Q1 (Column 23). The main driver of lower operating returns was the lack of loan growth from 2018 to 2021 with limited growth in interest income, while asset and share growth remained in double digits (Columns 11 and 12).
Return on Financial Leverage (ROFL), a Measure of Financial Returns
The second component is the credit union’s return on financial leverage (ROFL). This reflects both the degree to which the credit union employs shares and borrowings to finance its operating strategy and the cost of these debt funds. A credit union’s return on financial leverage (ROFL) measures the efficiency with which the credit union uses shares and borrowings to fund earning assets not funded by equity capital and the loan loss reserve. ROFL is the product of the credit union’s leverage spread (LS) times the leverage multiplier (LM).
In a strategy to support strong member growth, share growth remained strong with the associated cost of adjusted debt (COD) declining. Due to low interest rates, COD fell from a peak of 1.09% in 2019Q4 to 0.49% in 2022Q1 (Column 28). COD is interest expense divided by earning assets less equity capital and the loan loss reserve.
The leverage spread measures the ROEA less the COD or Column 16 less Column 28 to equal Column 29. The LS fell from 1.42% in 2018 to 1.33% as of December 31, 2019, to 1.08% as of March 31, 2022.
The leverage multiplier of adjusted debt (earning assets less equity capital and the loan loss reserve divided by equity capital and the loan loss reserve) rose from 7.3-times as of December 31, 2019, to 8.0-times as of March 31, 2022 (Column 30).
ROFL measures the level the credit union uses leverage and the cost of financing that leverage to fulfill its financial strategy. ROFL peaked at over 10% in 2018, declined to 9.34% as of December 31, 2019, and fell to 8.37% as of March 31, 2022 (Column 17).
Return on Equity (ROE)
Combining the operating return (ROEA) with the financial return (ROFL) equals return on equity (ROE). Understanding the components of ROE allows better operating and financial decisions in managing a credit union.
Operating Profit Margin
Another method to understand credit union fundamentals is the operating profit margin (inverse of the efficiency ratio) or operating profit (net interest and noninterest income minus operating expenses, excluding loan loss provisions) divided by net interest and noninterest income (Column 26). The operating profit margin was 30% as of December 31, 2019 and declined to 27.6% as of March 31, 2022.
While full-time employees per million dollars of net operating revenue declined from 4.32 in 2019 to 4.01 in 2022, the cost per employee rose dramatically. Payroll expense as a percent of net interest and noninterest income rose from 35.4% in 2018, to 36.2% in 2019Q4, to 37.7% in 2022Q1. Office occupancy expense as a percent of income increased from 12.8% to 12.9% and to 13.3% in 2022Q1. Since the end of 2019, these large components of expense together rose from 49.1% to 51%, accounting for a portion of the decline in the operating profit margin. These higher costs, coupled with flat interest income since 2019, reduced operating profit margins significantly. The decline in operating profit margins since 2019 corresponds to the narrowing in IDCFP’s ROE and its components as noted above.
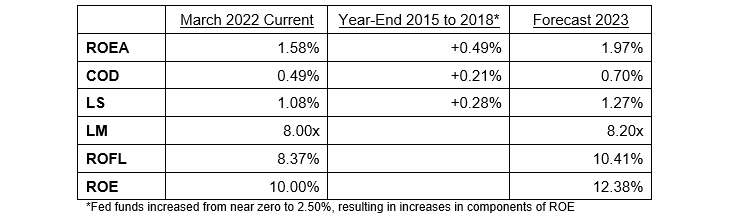
Given the federal reserve increases the fed funds rate to 2.50% in 2022, the impact would parallel a similar event from 2015 to 2018. IDCFP uses this comparison to forecast profitability in 2023 (see Table I).
An economic recovery in 2023 and 2024 with strong loan growth and higher yields on loans accelerates the growth in interest income and will restore operating profit margins to 30% and return on equity to 12% or higher.
Table I
Key Takeaways from History in Forecasting ROE for Credit Unions
Credit Unions National Totals

Contact IDCFP (800-525-5457 or info@idcfp.com) to request a Financial Ratio Review of your credit union in the attached format for $295. To view all our products and services please visit our website www.idcfp.com.
John E Rickmeier, CFA
President
jer@idcfp.com
Robin Rickmeier
Marketing Director