Decline in Inflation with No Recession Equals a Soft Landing: Low in S&P 500
In order to understand future declines in core CPI, we highlight points from Tom Lee’s FSInsight and apply some of our insights.
- Implied inflation 1-year dropped from 6.3% to 4.8%, 5-year declined from 3.6% to 2.9% and 10-year fell from 2.9% to 2.6%.
- Year-end 2022 market pricing of Fed funds rate fell to 2.6%, down 40 basis points from over 3.0% in early May.
- Tom Lee of FSInsight, in conversation with one of the largest privately held food producers in the U.S., reported the producer sees outright “deflation” coming in fish, chicken and beef prices.
- Lumber prices are down 52% compared to a year earlier, and off 62% from its peak, which forecasts decline in housing prices.
- New home supply increase to the highest level since 2009. In addition, there is a surge in home listings with “price drops.”
- Using Indeed.com data to forecast JOLTs, or job openings, indicated declines in April and May. JOLTs, last reported in March, will not be updated until mid-June. The Fed relies on this data.
- Tech bust takes next step: layoffs and hiring freezes.
Coming Decline in Core CPI
Price of Apparel, Home Furnishings, and New and Used Cars account for 30% of the increase in CPI and all are forecast to decline; the impact is deflationary.
- Prices of New and Used Cars, making up 4% of CPI weight, each contributed 0.5% and 0.7%, respectively, or 1.2% of the 8.2% CPI in April, and are expected to decline dramatically per the Manheim Index.
- Prices of Home Furnishings and Apparel, accounting for 4% and 2% of CPI weight, respectively added 0.4% and 0.1%, or 0.5%, of the 6.2% CPI, are expected to decline.
- The dollar edged lower Friday in its second-weekly decline as traders pared expectations for U.S. Fed interest rate hikes, and as improving inflation and consumer spending data eased recession fears, reducing commodity prices.
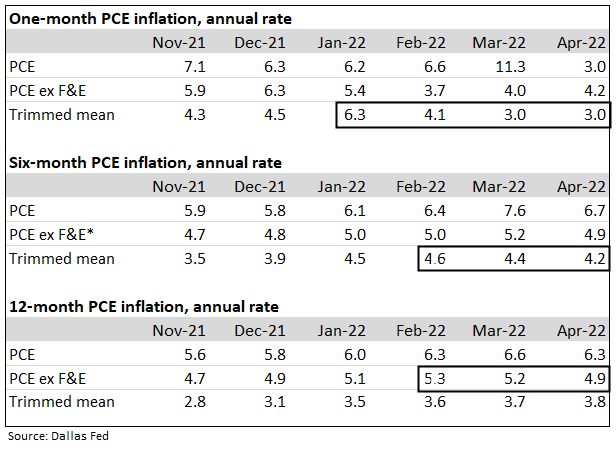
For a more comprehensive analysis of components, IDCFP relies on trimmed mean PCE for the underlying trend of inflation.
The Trimmed Mean PCE inflation rate is an alternative measure to sticky inflation in the price index for personal consumption expenditures. It is calculated by staff at the Dallas Fed, using data from the Bureau of Economic Analysis (BEA).1
Trimmed mean PCE inflation measured month-to-month peaked in January at a 6.3% annual rate, fell to 4.1% in February and 3.0% in March and April. The six-month annualized rate peaked in February at 4.6% and declined to 4.2% in April and is forecast to recede to 2.2%. Core PCE percent change from a year ago declined in each of the last two months, falling to 4.9% in April and forecast to recede to 2.4% by 2023, an acceptable rate of inflation for the Fed (see Chart I and Table I).
Chart I
Month-to-Month Trimmed Mean PCE Peaked in January 2022 and Forecasts Year-Over-Year to Decline to 2.2% by Year-End 2023

Table I
PCE Inflation Rates
Core PCE Inflation Forecast
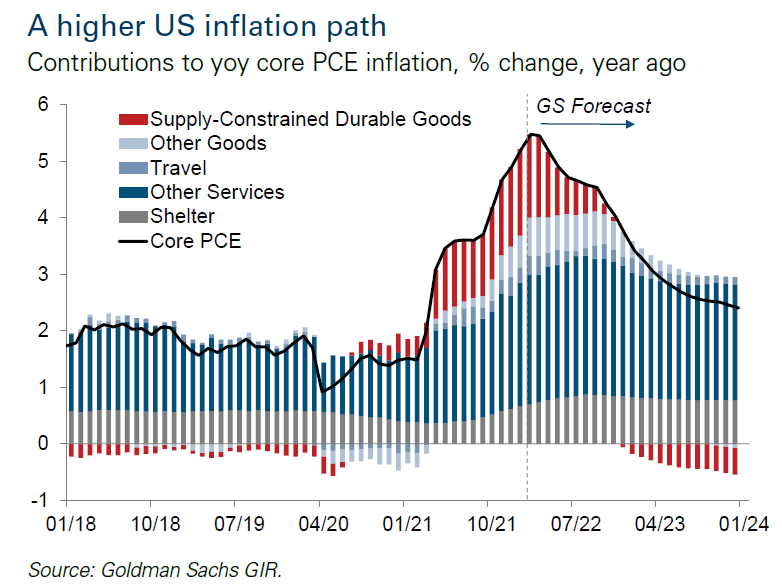
Goldman Sachs economists forecast core inflation (PCE) to fall under 4% by year-end 2022 from 4.9% currently and decline to 2.4% by the end of 2023 (See Chart II).2
- “Supply-constrained” goods swing from being a major contributor to inflation in the second half of 2021 and the first quarter of 2022 to a deflator in 2023, thereby reducing core PCE in late 2022 and the year 2023 by as much as 40 basis points.
- Auto-related CPI contribution was 197bp of the 393bp rise in core CPI and is now narrowing significantly.
- The increase in shelter contribution peaks at 90bp by mid-year 2022 and moderates to 80bp by year-end 2023.
Chart II
Crude Oil Prices Peak in June 2022
EIA expects crude oil prices to be higher than $100 a barrel in the coming months, and then a decline later in 2022 into 2023.3
On February 24, 2022, Russia initiated a further invasion of Ukraine that contributed to the recent sharp increase in the Brent and West Texas Intermediate (WTI) crude oil prices. This sharp rise in crude oil prices reflects increased geopolitical risk and uncertainty regarding how announced and potential future sanctions may affect global energy markets.3 In our April 2022 article, Inflation Peaks by Mid-Year 2022, we forecast the price of international benchmark Brent crude oil at $100 to $120 per barrel for the second quarter of 2022. Brent reached $123 on May 31, 2022.
The forecast for the price for WTI, the U.S. benchmark, is to average over $120 in June 2022. This forecast is subject to heightened levels of uncertainty due to various factors, including how Russia’s invasion progresses in Ukraine, government-issued limitations on energy imports from Russia, Russian petroleum production, and global crude oil demand.3
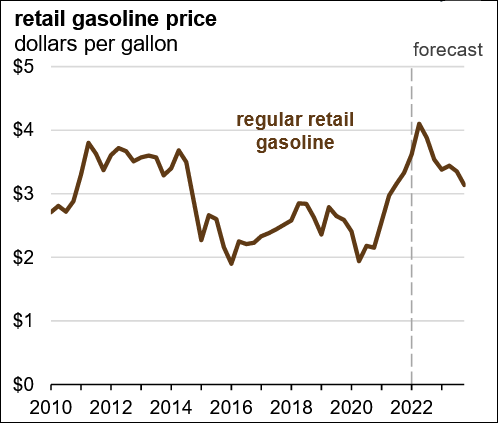
The forecast of Brent crude oil price increased the forecast for the retail price of gasoline. Expect gasoline in the United States to continue rising to a forecast high of $5.00 per gallon in June before falling through the rest of the year. We forecast the U.S. regular retail gasoline price will average $3.50 to $3.79 a gallon in the second half of 2022 and $3.00 to $3.33 a gallon in 2023 (see Charts III and IV).
Chart III
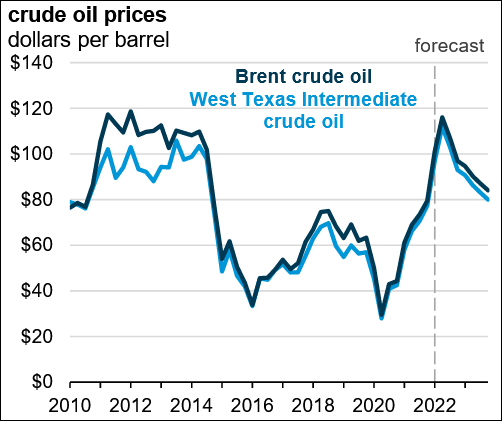
Chart IV
Ed Morse, a contrarian, and Citi’s Global Head of Commodity Research predicted on March 9 that December 2022 oil contracts would sell at $89 or less by year-end. “Today everyone seems bullish in the oil market, just like 2008 when Brent crude prices hit a record high of $150 a barrel, only to crash a few months later.”4 Morse agrees today’s oil market is tight and Russia-Ukraine war has escalated prices, but he anticipates a change in the second half of 2022. In his analysis, the market will shift from tight to surplus beginning in the spring of 2022. The shift is due to rising production from OPEC+, the Permian Basin and other U.S. shale basins, plus increased production in Canada and Brazil.
Morse has further indicated the SPR release and stated buy backs of crude will increase drilling rates by 1.3 to 1.5 million barrels of oil per day in the second half of 2022, over and above the one million barrels per day from the SPR release. Additionally, he states diesel prices were raised by equivalent natural gas price spikes increasing to new highs, but declining natural gas prices by the summer will cause a peak in diesel prices.5
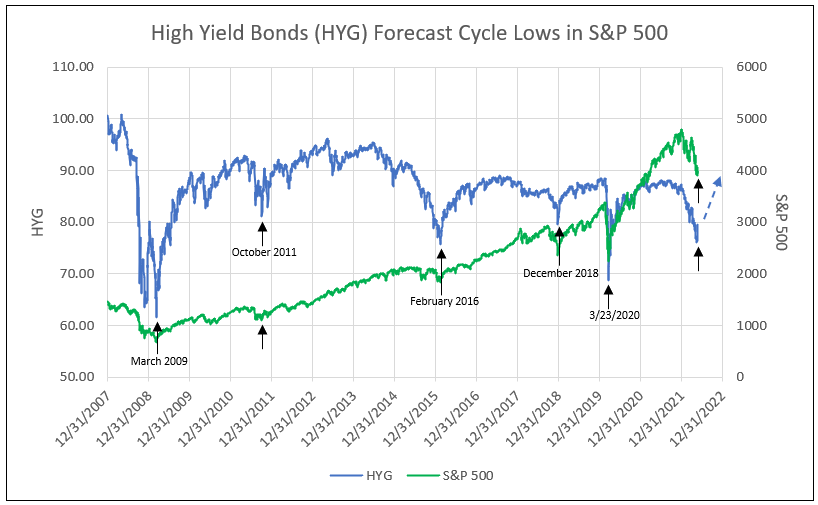
A Peak and Decline in Inflation with No Recession, HYG Price Reaches a Low and Recovers
A steep and sudden decline in price and reversal of the high yield corporate bond ETF (HYG) has historically forecast all stock market cycle lows. Note the evidence in the chart below on these dates: March 2009, October 2011, February 2016, December 2018, March 2020, and May 2022.
Note: IDCFP forecast the S&P 500 low on May 20, 2022. In late 2008, HYG fell to a low followed by a recovery, but then fell to a lower low in 2009. Today a similar pattern would be required to forecast a new “bear market” low (see Chart V).
Chart V
High Yield Bond ETF (HYG) Reaches a Low on May 18, 2022
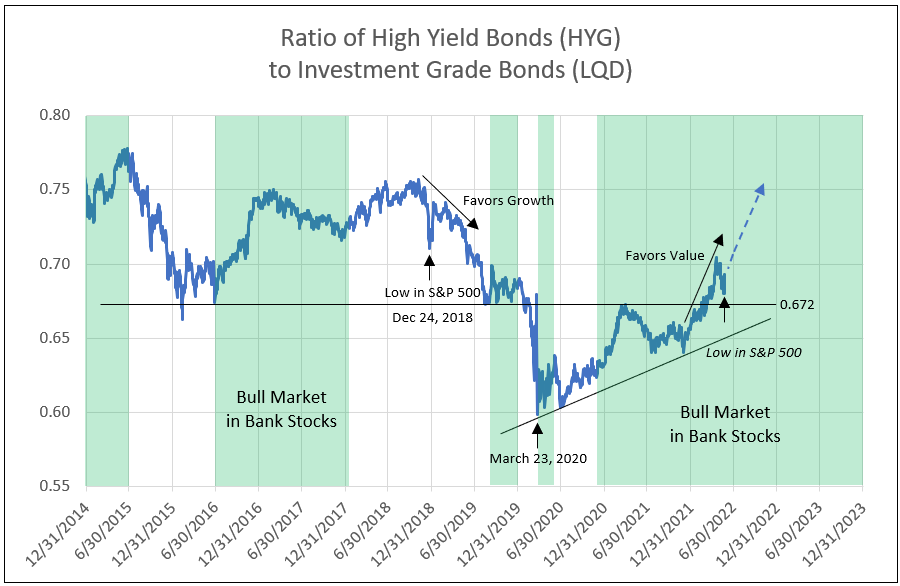
The low in the ratio of High Yield (HYG) to Investment Grade (LQD) corporate bonds coincides with the cycle low in HYG. More importantly, the trend in the ratio forecasts a stock market leadership, i.e., growth versus value. A rising trend beginning in February 2016, and especially from June 2016 to early 2017, and late 2017 to early 2018, favored value and bank stocks versus growth. Value was again favored from August to December 2019.
Following the March 2020 market low, value stocks initially rose with the ratio, but did not breakout until October 2020 to May 2021. Value again outperformed since November 2021 as a defensive position. Currently the HYG and HYG/LQD are in a V-formation with the low indicating the low in the S&P 500. A significant recovery in HYG from 80 to 89 in the remainder of 2022 sets the stage for leadership of bank and value stocks compared to growth (see Chart VI).
Chart VI
1 The Federal Reserve Bank of Dallas
2 Tom Lee’s Insight of Fundstrat letter from April 25, 2022
3 EIA expects crude oil prices higher than $100 per barrel in coming months
4 What If Goldman Is Wrong and a Lonely Oil Bear Is Right?
5 Citicorp’s Ed Morse interview on CNBC Fast Money
To view all our products and services please visit our website www.idcfp.com. For more information about our ranks, or for a copy of this article, please contact us at 800-525-5457 or info@idcfp.com.
John E Rickmeier, CFA
President
jer@idcfp.com
Robin Rickmeier
Marketing Director