Inflation Measured by Dallas Fed’s Trimmed Mean Core PCE Indicates Transitory Inflation
The cycle low and continued increase in U.S. T-Note yields is due to several reasons.
- A massive short position, which anticipated significant yield increases, was covered to limit losses.
- Foreign buying of U.S. Treasuries since dollar hedge U.S. yields continue to exceed foreign government yields hedged for currency risk.
- The U.S. Treasury discontinued draining the TGA account at the Fed, which had allowed the Treasury to limit new debt issuance, as it reduced the TGA account by $1.6 trillion in 2021.
- The Fed is expected to taper purchases of U.S. Treasury securities in 2022.
- The temporary lifting of the debt ceiling, allowing issuance of Treasury debt.
The yield on the 10-year is expected to increase to 2.0% by year-end and 2.4% in 2022.
What About Inflation?
When the 10-Year yield minus the core PCE inflation rate reaches its most negative point and reverses, this forecasts a low and recovery in the TIPS yield (see Chart I). Or, the U.S. Treasury ending the drain of the TGA account to avoid financing new debt or the Federal Reserve changes policy and begins tapering, or announces potential to begin tapering, mortgage and bond purchases, this leads to the same outcome, with the private sector buying more Treasury debt.
Chart I
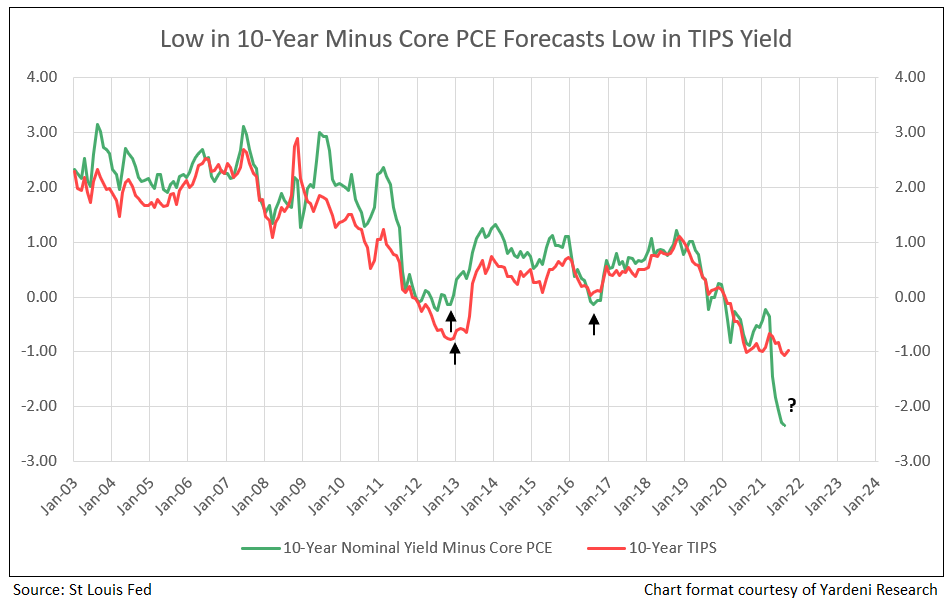
Low in the TIPS yield plus implied inflation determines the low in the nominal 10-year yield. In today’s environment, low nominal yields are due to a TIPS yield low of negative 1.2% in August.
However, by using the US 10-Year yield less the trimmed mean core PCE inflation rate (thereby eliminating the extreme highs and lows of the components) the low has already occurred, forecasting a sharp increase in the 10-year TIPS yield from -1.2% to +0.2% over the next year (see Chart V). Adding implied inflation of 2.4% forecasts the recovery in nominal 10-year from the current level of 1.5% to 2.0% by year end 2021. Bank stocks would be the major beneficiaries of the increase in nominal 10-year yields (see Charts II and IV).
Chart II
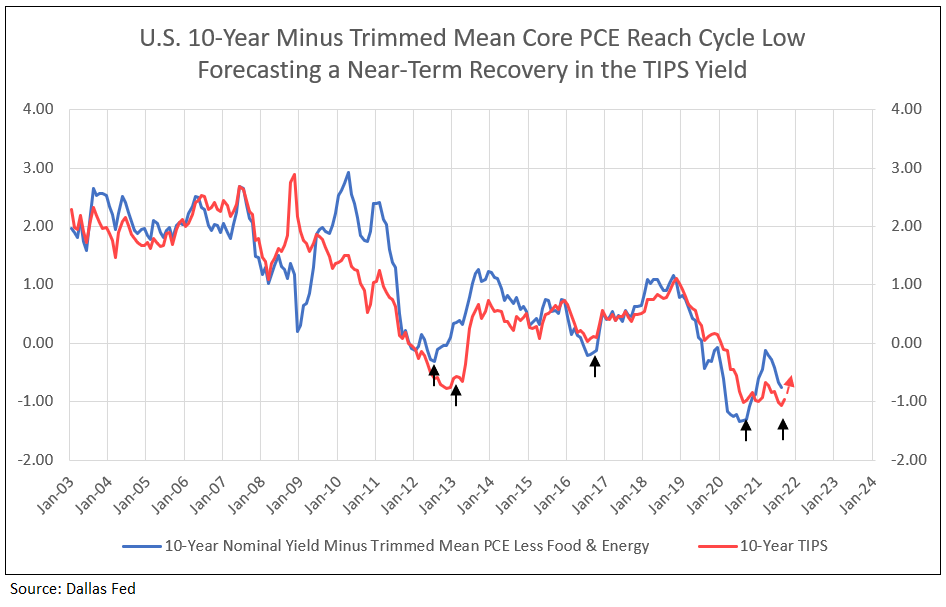
Chart III
The Trimmed Mean PCE inflation rate is an alternative measure of core inflation in the price index for personal consumption expenditures (PCE). It is calculated by staff at the Dallas Fed, using data from the Bureau of Economic Analysis (BEA).1
Table I
Trimmed Mean PCE Inflation Rates
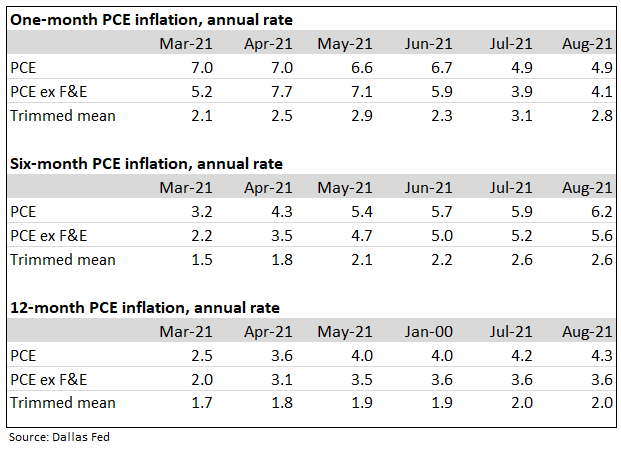
Despite headline 12-month PCE inflation of 4.3% in August 2021, trimmed mean PCE (excluding food and energy) was flat at 2% (see Table I).
Housing Poised to Become Strong Driver of Inflation
The major risk in using the trimmed core PCE inflation rate is the coming 1% plus addition to core PCE from housing shelter component in 2022 and 2023. Could the current extreme components like used car prices, high transportation costs from shipping, and general shortages generating high product prices, diminish in 2022 in 2023, allowing trimmed core PCE to remain under control?
- “The Consumer Price Index (CPI) and the Personal Consumption Expenditures Deflator (PCE) jumped to their highest annual rates since 2008 in April and are likely to accelerate further in the near term. However, due to how shelter costs are measured, the housing components of the indices decelerated considerably over the past year, despite strong home price appreciation. This has kept topline inflation from being even higher.”2
- “Lagged effects from the past year's house price appreciation and more recent rent recovery could begin to flow into inflation measures as soon as the May readings. House price gains to date suggest an eventual acceleration in shelter inflation from the current rate of 2.0 percent annualized to about 4.5 percent. If house price growth continues at the current pace, shelter inflation would likely move even higher.” 2
Rent and owners’ equivalent rent (OER)—the amount of rent equivalent to the cost of ownership—are among the most important components of the Consumer Price Index (CPI) and the personal consumption expenditures (PCE) price index.3
The Dallas Fed forecasting model shows that rent inflation and OER inflation are expected to increase materially in 2022 and 2023. Given their weights in the core PCE price index, rent and OER together are expected to contribute about 0.6 percentage points to 12-month core PCE inflation for 2022 and about 1.2 percentage points for 2023.3
These forecasts also suggest that rising inflation for rent and OER could maintain the overall and core PCE inflation rates above 2 percent in 2023, when current supply bottlenecks and labor shortages may have subsided.3
Table II below shows that, "all else equal, the acceleration in rent and OER inflation by December 2023 would raise overall and core PCE inflation by about 0.5–0.6 percentage points relative to their pre-pandemic levels of 1.8 percent.”3
Table II
Expected Increase in Overall and Core PCE Inflation Relative to Pre-Pandemic Level3

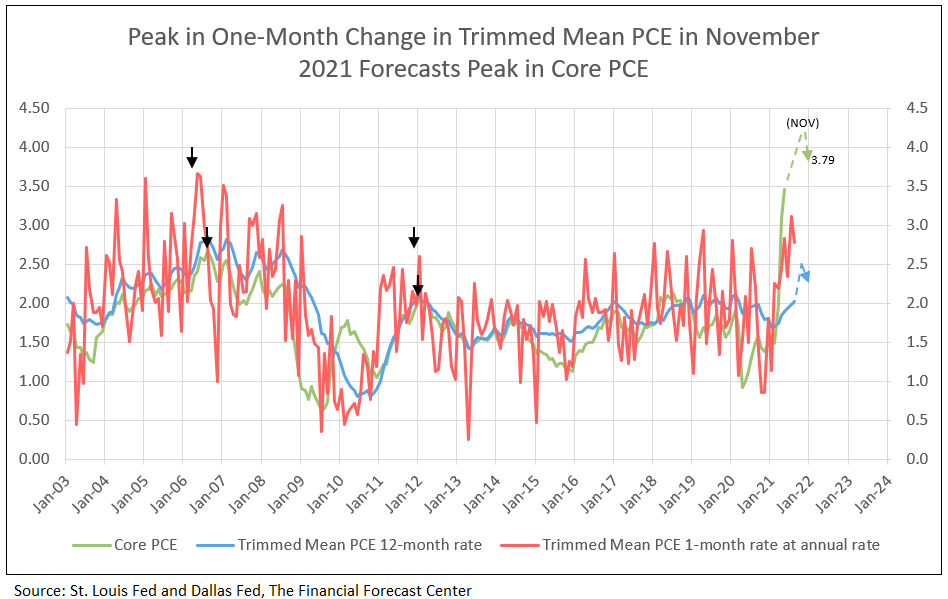
We conclude the 1-month trimmed mean core PCE growth will peak in November 2021, with the 12-month change in trimmed mean core PCE peaking six months later in 2022 (see Chart II). The Federal Reserve opinion that the current bout with inflation is temporary is, in our opinion, correct.
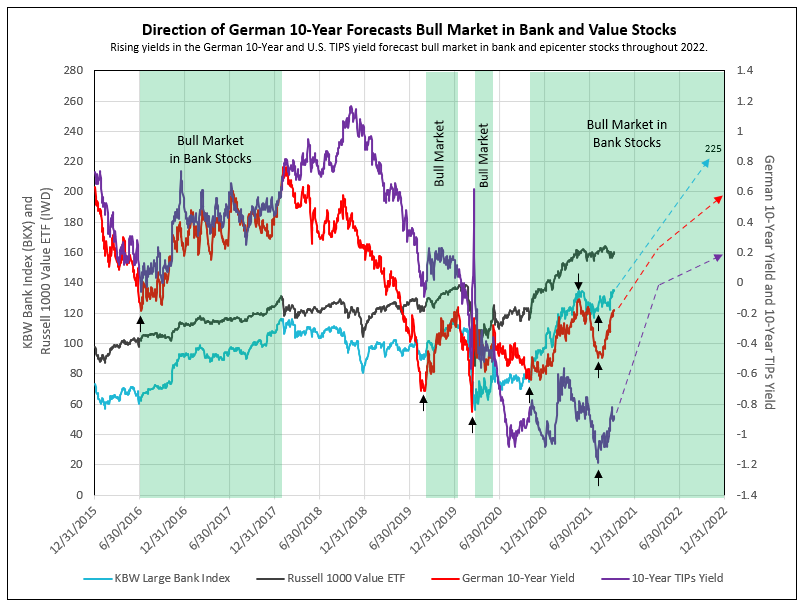
Bull Markets in Bank Stocks
- Since 2015, the bull markets in bank stocks began with a cycle low in the German 10-year confirming a low in the U.S. 10-year yield (see Chart IV).
- The first leg of bull market in bank stocks began in October 2020 and ended in mid-May 2021, as the German 10-year yield reached its peak of -0.11%.
- An intermission occurred between legs from May to August 2021, as the German 10-year yield declined to its cycle low.
- The next upward leg of the bank bull market began in October 2021 as the German 10-year approached its prior peak yield and the BKX (large bank stock index) rose to new cycle highs.
Low in Dallas Trimmed Mean Core PCE and Other Fed and U.S. Treasury Actions Forecast Low in 10-Year Yield in August
Chart IV
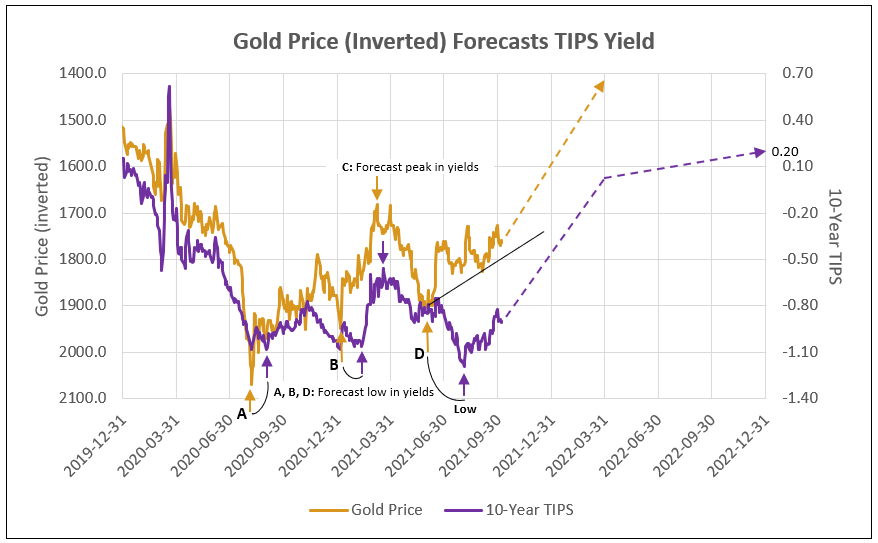
The Price of Gold Forecast Direction and Level of the 10-Year TIPS Yield
Declines in the price of gold from peaks in 2020 and January and June of 2021 (shown inverted on the chart below) forecast lows in TIPS yield. See IDCFP’s article that discusses this relationship in more detail.
Gold broke support at 1,755 to lower prices. The next support was 1,678 (C on Chart V). Gold is expected to decline to 1500 and as low as 1400 by March 2022. All this forecasts the 10-year TIPs yield of 0.0% and nominal of 2.4% in 2022 (see Chart V).
Chart V
1: The Federal Reserve Bank of Dallas
2: Fannie Mae, Housing Insights: Housing Poised to Become Strong Driver of Inflation, June 9, 2021.
3: Surging House Prices Expected to Propel Rent Increases, Push Up Inflation, August 24, 2021
To view all our products and services please visit our website www.idcfp.com. For more information about our ranks, or for a copy of this article, please contact us at 800-525-5457 or info@idcfp.com.
John E Rickmeier, CFA
President
jer@idcfp.com
Robin Rickmeier
Marketing Director